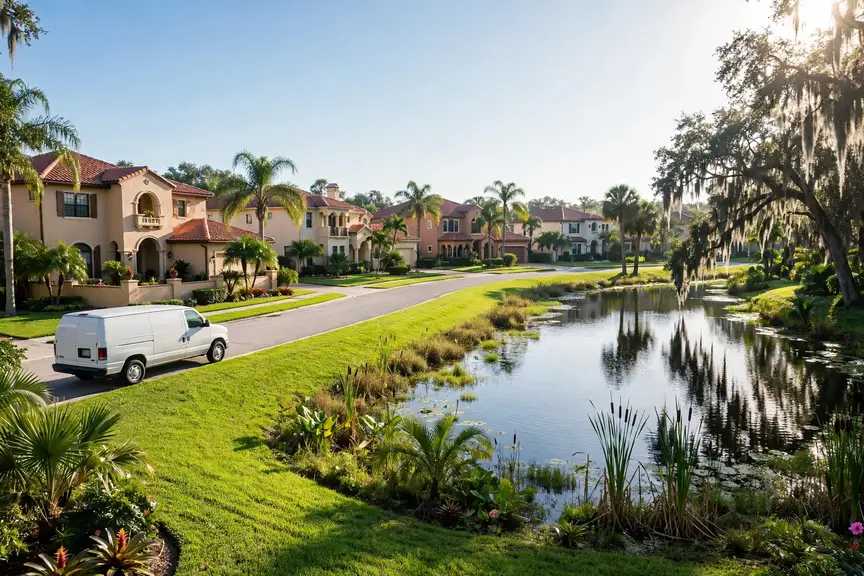


This is Orlando's plumbing page, built from Orlando's own numbers: Census housing figures, the metro's ZIP codes and its NOAA climate record. PlumbReach USA routes your call to an independent local plumber; the homework below is here so you know your home's likely problems before you ever make it.
Call center hours: Mon-Fri 7:00 AM-10:00 PM ET | Sat 8:00 AM-10:00 PM ET | Sun 7:00 AM-9:00 PM ET
The median Orlando home was built in 1994; 24.7% of the stock predates 1980, and the pattern this metro's own data ranks first is slab leaks under concrete foundations. PlumbReach USA is a referral service, not a plumbing company: one call connects you with an independent local plumber serving your ZIP code.
Orlando is a metro of 2,721,022 people and 985,142 households, and its plumbing is a portrait of its building history. The median home here was built in 1994; 24.7% of homes predate 1980 and 7.5% predate 1960, while 38.9% have arrived since 2000. Every one of those eras plumbed differently — different pipe materials, different drain designs, different fixtures — and they fail differently, which is why this page is organised around the patterns the data actually produces in Orlando rather than plumbing in the abstract.
By now, most of Orlando's pre-1980 homes are on their second plumbing lives in part: a heater replaced, a bathroom renewed, a section of drain renewed after a failure — while the remainder of the original system carries on into its sixth and seventh decades. The 276,758 homes in that stock are therefore not uniformly old; they are individually old, each with its own archaeology of repairs. That is why the pre-1980 districts reward inspection over inference: the street's average says little about the house in front of you, whose real history is written under its floors.
There is a second way to read the growth figures: as a maintenance wave still approaching. The 435,866 homes built since 2000 were handed over with everything new at once — heaters, cartridges, supply lines, seals — and new things age in convoy. The first replacements in those subdivisions have begun; the wave behind them is arithmetic. Households in Alafaya and the other growth districts who learn their systems now, while the systems are still young, are the ones who will meet that wave as a schedule rather than a surprise.
Over the housing sits one more dataset, the sky's: 468 heating degree days and 3,694 cooling degree days in the average year at ORLANDO EXECUTIVE AP, FL US, an average temperature of 73.8 degrees, extremes at both ends faithfully recorded. A metro's plumbing is designed — to the extent it is designed at all — for the middle of that record, and it fails at the record's edges. What follows is a page about the edges: the cold snaps, the storm weeks, the long hot stretches, and the systems they find first.
Housing eras and climate, joined — the two datasets every section of this page is built from.
Lay the eras side by side instead: 7.5% pre-1960 (84,036 homes), 17.2% from 1960-1979 (192,722), 36.4% from 1980-1999 (407,854), and 38.9% since 2000 (435,866). No single era tells the story — the proportions among them do, and those proportions are different in every metro this site covers.
Growth is the headline in Orlando: the post-2000 band is the largest, much of it slab-built subdivisions plumbed in plastic and fitted with cartridge fixtures. The work here is young-stock work — heater replacements arriving in waves as whole streets age together, slab-line questions, fixture internals — carried out on systems whose first owners often never needed a plumber. The metro's older pockets still generate the deep problems, but the volume of its plumbing future is being written in the new subdivisions.
The runner-up era is 1980-1999, with 36.4% of homes. That stock has left its carefree decades and entered its maintenance decades, and it shows in the call pattern around Alafaya and the other districts of those years: heaters on their second or third cycle, fixtures reaching their wear points together, drains still young enough to reward attention over replacement.
Start the climate half where the water starts: underground. Orlando's laterals rest in soil that takes 51.47 inches of rain in an average year and dries between deluges, swelling and shrinking against their joints through every season. Above ground the same record reads as workload — 3,694 cooling degree days of hot-water demand, 468 heating degree days of cold incoming water at ORLANDO EXECUTIVE AP, FL US. A plumbing system here is never in neutral; the record keeps it working at one end or the other all year.
Hold the two halves together and the rest of this page explains itself: the problems ranked highest here are the ones where Orlando's dominant housing era and its climate record overlap. Change either dataset and the ranking changes — which is precisely why this profile is rebuilt from the records for every metro instead of carried over from the last one.
Listed in the order this metro's housing and climate data supports.
The expensive leaks are the quiet ones: a pinhole misting inside a wall, a slab line weeping into the ground for months. Finding them is a measurement exercise — meter behaviour, acoustic listening, pressure isolation — that narrows a whole house down to a square foot before a single board is lifted.
Detection work in Orlando has a local flavour because the construction does: leaks hide differently in the slab tracts around Orlando than in the raised-floor homes of the older districts, and the search follows the architecture. In slab homes the hunt runs through flooring warmth and meter behaviour; in older stock it runs through crawl spaces and wall cavities. Either way the discipline is identical — measure, narrow, confirm, then open exactly once — and it is what separates a located repair from a wall opened on a hunch and a leak still running behind the patch. The ORLANDO EXECUTIVE AP, FL US record — 468 heating degree days, 3,694 cooling — is the backdrop Lake County plumbers plan around.
Scale the problem by the Census count and it stays concrete: 1,120,478 housing units, each a small network of pressurised lines, each capable of losing water silently. The meters across Orlando register those losses in aggregate; the detection visit exists to assign one of them to one address — in Alafaya this month, somewhere else next.
Where this service gets booked in Orlando follows the map on this page: the older districts generate the deep-end work, the post-2000 subdivisions the wear-and-tear work, and the 407,854 homes in between split the difference. Telling the call center your home's build decade — most Orlando owners know it within a few years — puts the right kit on the van the first time.
Hot water is a daily expectation so total that its absence reorganises a household within hours. Heater servicing protects that expectation: burners and elements tested, sediment drained, the safety valve exercised, the anode's remaining life judged. When the tank itself is finished, installation replaces it with a unit matched to the home's demand and venting, set up to serve the same expectation for another decade.
Ask a Orlando plumber what kills water heaters and the answer is time plus sediment: the tank heats, minerals settle, the anode rod spends itself slowing the corrosion, and eventually the steel loses. The metro's climate keeps the cycle count high — long hot seasons pull more hot water through showers and laundry than a mild climate would — so heaters here earn their keep. Owners in Lake County who flush the tank yearly and keep an eye on the anode rod are the ones whose heaters reach the far side of a decade. Count it in homes if you prefer: 276,758 built before 1980, 435,866 since 2000, one shared system of soil and seasons.
The arithmetic behind the diary: 985,142 households heating water through 3,694 cooling degree days and 468 heating degree days a year — every one of those households a tank ageing on the same climate's schedule, from the pre-war homes to the newest builds around Kissimmee.
In Orlando this service is booked most often through the problem patterns at the top of this page — the metro's housing data, not habit, sets the order. If your home is in the 24.7% built before 1980, mention its age on the call: it changes the parts the plumber loads before heading to Orlando and the rest of the metro.
Supply pipe is a house's circulatory system, and its diseases are degenerative: rust narrowing the arteries, corrosion pitting the walls, joints weeping at the seams. Repair treats the acute event. Repiping treats the disease — a planned replacement of the failing material throughout the home, staged so the household keeps water while its circulation is renewed, and verified under pressure before the walls close.
The repiping conversation in Orlando starts with its housing data: median build year 1994, 24.7% of homes from before 1980, and whole districts plumbed in materials that are now at or past their expected service lives. Galvanized lines in the older neighbourhoods have been narrowing from the inside for decades; the symptom homeowners notice — pressure fading year by year — is the pipe's inner diameter closing. One pinhole in that stock is an event; the third is a pattern, and the plumbers who work Orlando and the older core will say so plainly rather than sell a fourth repair. In Orlando that holds across 96 ZIP codes, from Orlando out to Pine Hills.
The repair-or-renew caseload is set by one figure above the rest: 24.7% of Orlando homes predate 1980, plumbed in the materials now at the end of their service lives. Around Horizon West (62,152 residents) as in the old core, that percentage is not an abstraction — it is the street's plumbing, house by house.
One local habit worth copying: Orlando homeowners who mention their street's building era when they book get a better-matched visit, because a plumber heading to a the 1990s home in Lake County loads different parts than one heading to a slab-built subdivision in Alafaya. The service is the same; the preparation is local.
The sewer line is the one pipe every fixture in the house shares, and the only one whose failure backs up into the home instead of draining away from it. Its enemies are time, roots and soil movement, working at the pace of decades. Service on the line begins with evidence — camera footage of its actual condition — because the difference between a cleaning, a sectional repair and a replacement is written inside the pipe, not in the symptom at the drain.
A lateral's enemies in Orlando are patient and they are local: roots working the joints under the canopy streets of Lake County, soil that swells with 51.47 inches of yearly rain and shrinks back in the dry stretches, and plain elapsed time in the districts where the pipe predates the pavement above it. Against enemies that slow, the camera is less a diagnostic luxury than the only honest calendar the line will ever get — footage that says whether the pipe has years left, or has been spending them. The remedy scales to that verdict and to no other. That is the daily reality for the 985,142 households spread across Lake, Orange, Osceola, Seminole.
Sewer demand follows the founding map: the districts built first, around the old centre and out through Four Corners, hold the jointed clay and iron; the growth rings hold plastic with decades in hand. 7.5% of the metro's homes stand on the founding side of that line, which is why the footage here so often shows a pipe at the end of its story.
Where this service gets booked in Orlando follows the map on this page: the older districts generate the deep-end work, the post-2000 subdivisions the wear-and-tear work, and the 407,854 homes in between split the difference. Telling the call center your home's build decade — most Orlando owners know it within a few years — puts the right kit on the van the first time.
Emergencies in Orlando are answered by local independents, not a dispatch centre: PlumbReach USA routes the call, and the stock it serves — 1,120,478 homes across 96 ZIP codes — is the stock this page profiles.
Orlando's drains are cleared by local independents who work this stock weekly: a median build year of 1994 means most lines they open have decades of history in them, and the clearing approach is chosen for the era, not the postcode.
In Orlando, a toilet that runs all night is a water bill with a sound; the local service replaces the tired internals and checks the flange and supply while the tank is open.
In Orlando the faucet call is often the first plumbing visit a newer home ever gets — the professionals routed here treat it as an introduction: the fixture fixed, and the home's shutoffs and heater age noted for the record.
There is a plainer way to say what this page's ranking means in practice: most calls in Orlando are two calls. The first answers Slab leaks under concrete foundations; the second answers water heaters working hard year-round. Between them they account for the shape of a local plumber's week here — the districts visited, the parts stocked, the diagnoses made fastest because they are made most often. The remaining services divide the rest of the diary among them, essential but episodic, the supporting work around two leading patterns.
Selected and ranked from this metro's housing-age profile and climate record — not copied from another city's page.
The slab leak's cruellest feature is its patience. A pinhole in a pressurised line under concrete does not rest: it runs at night, on holidays, while the house stands empty, moving water into soil that carries it away unseen. Weeks of that patience show up in the aggregates — a bill trending up across three statements, a meter reading that will not reconcile with the household's habits. In Orlando's slab-built districts the pattern repeats in house after house of the same subdivisions, because the lines were poured in the same seasons and age in convoy. Detection ends the patience at a marked point on the floor.
The physics under the slab are patient ones. A pressurised copper line resting against aggregate, flexing a fraction with every heating and cooling cycle and every shift of the soil, can wear or corrode at a single point for years before it opens. When it does, the leak is small and constant — which is worse news than a dramatic break, because it can run for months, feeding moisture into the soil the foundation bears on and quietly inflating every water bill. The signs stay indirect precisely because the water never surfaces: it moves down and out, not up. That indirection is why slab leaks are a detection problem first and a repair problem second, and why the listening equipment that locates the leak to a marked square of floor changes the whole shape of the job.
The local denominator matters: 435,866 of the metro's homes went up since 2000, most on slabs, most with lines beneath them. Even a small failure rate across that many buried runs produces a steady stream of leaks — and the stream is young, because those lines are only now reaching the age where soil movement and hot-water cycling start their work.
A water heater keeps its accounts in two currencies: temperature and time. Every shower is a withdrawal; every degree the incoming water must be raised is a tax on the recovery. Orlando taxes its tanks from both ends — summer demand volume against winter inlet cold — and the fleet pays out accordingly, the oldest units in the oldest homes first. The strain is rarely visible from outside the closet: it is a shower ending cooler than it began, a tank that fires at hours when nobody has drawn water, a household quietly reorganising its mornings around an appliance's fatigue. Those are the entries in the ledger that precede the failure itself.
Recovery time is the number that runs a household's mornings, and it is the first thing sediment steals. A tank rated to serve a family when new delivers less hot water per heating cycle every year as the sediment layer thickens and the burner's work goes into heating rock instead of water. In Orlando, where summer demand piles showers, laundry and dishwashing into the same hours, that slow decline shows up as a household quietly rationing hot water without ever deciding to. Flushing the tank returns some of it; a spent anode and a rumbling, scaled tank are the signs the decline has become structural, and the conversation turns to replacement.
Scale the problem by the metro: 1,120,478 housing units, each with a tank cycling through 3,694 cooling degree days of demand a year. The fleet ages in formation — suburbs built in one boom replace their heaters in one wave — so strain is not randomly distributed across Orlando; it arrives neighbourhood by neighbourhood, on the building calendar.
Galvanized pipe does not fail loudly; it fails by narrowing. Zinc coating gone, the steel rusts from the wet side, and every year the passage water travels through is a little smaller than the year before. The household reads it as personality — the shower that weakens when a tap opens, the washing machine that fills slowly, the rust tinge after a holiday — until the day a pinhole opens in a wall and the personality becomes a flood. In housing built when galvanized was simply how houses were plumbed, the whole system is one age and one material, which is why the faults stop being isolated: the pipe is not breaking in one place, it is finishing in all of them at the same pace, and the repair conversation has to reckon with that arithmetic.
The geography of galvanized failure inside one house is uneven, and the unevenness misleads people. The runs nearest the water heater corrode fastest, worked by heat; long horizontal runs narrow differently from vertical risers; the line to a little-used guest bathroom may be nearly closed while the kitchen still flows. This is why a Orlando home can seem fine at most taps while one shower has given up entirely. Repiping answers the whole geography at once, which is its real argument: not that any single run has failed, but that the system's remaining life is scattered unevenly through every wall, and spot repairs keep buying the shortest-lived section.
Count it by era rather than by street: the metro's homes built between the war years and 1980 — the heart of the galvanized period — number in the tens of thousands here, and the 276,758 pre-1980 homes overall are the pool this problem draws from. Plumbers working Orlando and the older districts can often date a home's pipework from the kerb, because the building booms that raised those neighbourhoods plumbed them all the same way.
Ownership is the first surprise with a lateral: the buried stretch between the house and the street main typically belongs to the homeowner, however public it feels. The second surprise is its age. In Orlando, laterals under the older streets were laid for the homes counted in the 276,758 pre-1980 properties — jointed clay or iron, bedded in soil that has swelled and shrunk through 51.47 inches of rain a year ever since. A pipe can be nobody's thought for fifty years and then become the only thought in the house, usually on the evidence of the ground-floor drain in it.
The lateral is the hardest-working pipe a household owns and the only one nobody ever sees. It carries everything, it was buried once and forgotten, and its condition depends on decisions made the year the house was built: the material chosen, the slope it was laid at, the soil it was bedded in. Ageing laterals fail in characteristic ways — joints offset as soil settles, bellies where the bedding washed or sagged, walls thinned by decades of flow. The house above reports these failures indirectly, through its ground-floor fixtures, which is why a sewer problem so often gets mistaken for a simple clog at first. In Orlando, where whole districts were built in the same few decades, laterals are ageing on a shared timetable — the line under one house is a fair guide to the line under its neighbour's.
Every one of the metro's 1,120,478 housing units drains through exactly one lateral, and in the older districts those laterals are as old as the streets above them. The pre-1960 share alone — 84,036 homes — represents that many buried lines in their seventh decade of service, under soil that shifts with Orlando's wet and dry seasons. Most will never draw attention; the ones that fail announce themselves through the ground-floor fixtures first.
Cast iron's failure is chemical before it is mechanical. Decades of waste water and vent gases work the pipe's crown and bore, converting sound iron to a roughened, thinning shell whose inner surface snags everything the household sends down. In Orlando, where 84,036 homes predate 1960, that chemistry has had sixty years and more to run. The symptoms arrive from the bottom of the system upward — the ground-floor fixtures complain first — and the diagnosis is a camera run that reads the bore the way a doctor reads a scan: where scale can be scoured back, and where the pipe itself has become the obstruction.
Look inside an old cast iron line with a camera and the failure stops being abstract. The inner wall grows rough with tuberculation — rust nodules that narrow the bore and catch everything passing. The bottom of the run, where water and grit travel, thins fastest; the top can look sound while the channel below it is nearly through. Roots enter at joints and add their own blockage. A Orlando line of this vintage is therefore not one problem but a profile of problems along its length, and the repair that makes sense — cleaning, a section, a full replacement — is the one matched to the worst ten feet the camera finds, not the average of the whole run.
Count it from the Census side: 84,036 homes in this metro predate 1960, and the drain lines beneath them were cast in an era that assumed a working life now fully spent. They will not all fail at once — they will fail one street at a time, in the order the corrosion reaches, which is what makes the pattern a ranking on this page rather than a footnote.
Storm season changes the plumbing risks in Orlando. Heavy rain pushes groundwater up around buried lines and can flood low-lying drainage, and homes here learn which of their drains sit at the bottom of the system the hard way — a floor drain or a basement fixture is where a surcharged line shows first. Before the season, it is worth knowing how your home behaves: whether the yard drains toward or away from the house, whether the sewer cleanout cap is sound, and where the main water shutoff is if a line is damaged. After a major storm, running every drain and watching the ground-floor ones tells you within minutes whether the line is moving water normally again.
When the storms come, Orlando's plumbing meets them in the ground: laterals under saturated soil, cleanouts under standing water, ground floors at the level the water is looking for. The season tests the buried half of every system here, and it tests the older districts — where the lines are jointed clay and iron — hardest of all. Preparation is unglamorous and specific: know the cleanout, know the shutoff, know the ground-floor drain in the house.
Consider where the water goes. A supply line pierced under a slab does not announce itself in the room above; it irrigates the ground the house stands on, sometimes for a season, and the house reports it sideways — flooring that cups, a baseboard that darkens, a gas bill that climbs as the heater feeds the leak's appetite for hot water. Orlando's slab-built stock — the tracts around Orlando and the 435,866 homes poured since 2000 — holds this risk in common: same design choice, same concealment. The metro's older pier-and-beam homes leak too, but they leak visibly, into crawl spaces, where a flashlight finds them. The slab keeps its secret until somebody goes listening for it.
Read the ranking backwards and it reads as a data summary: 2,721,022 residents in 1,120,478 housing units, 7.5% of the housing from before 1960, 51.47 inches of rain in an average year. The pattern leads because the exposure is broad — counted not in individual unlucky houses but in whole eras of the metro's building, stacked one on another.
The first visit follows a short, diagnostic list — each item ruling a branch of the problem in or out:
 PROBLEM
 SOLUTION
Population 311,732
Population 90,874
Population 82,264
Population 79,504
Population 62,292
Population 62,152
Population 61,963
Population 60,443
Population 56,202
Population 47,885
Population 47,182
Population 45,657
Also in the Orlando metro: Clermont (population 44,984), University (population 42,481).
Beyond Orlando itself, the metro takes in Alafaya (90,874 residents), Pine Hills (82,264) and the rest of the communities in the grid above — each plumbed in its own building era, which is why two streets in the same metro can need entirely different plumbing conversations. The ZIP list below is the full coverage footprint: if your code is on it, this page was written about your housing stock.
Beyond the largest communities sit Kissimmee (79,504), Sanford (62,292), Horizon West (62,152), St. Cloud (61,963), Four Corners (60,443) — smaller places across Lake, Orange, Osceola, Seminole, covered on the same terms. Their housing tends to be older on average than the big suburbs', and their calls follow the older patterns on this page. One routing covers them all: find your ZIP code below and the rest is a phone call.
Start with Orlando itself: 311,732 residents, 11.5% of the metro — the centre the rest of the map orbits. Alafaya (90,874) and Pine Hills (82,264) form the next ring out, housing with its own building decades and its own plumbing generations. Beyond them the metro thins into the smaller communities in the grid above, each a few thousand households deep — small in population, identical in one respect: their pipes answer to the same eras and the same weather as the big city's.
Administratively the metro is drawn from Lake, Orange, Osceola, Seminole — 4 in all — with Lake County at its centre. County lines do not change pipe physics, but they do shape the paperwork around the work: permits, inspections and code details are county and city business, which is one reason the professional who serves your street is a local one.
Beyond the metro line, the nearest covered metros are Palm Bay–Melbourne, FL (41 miles away), Lakeland, FL (44 miles) and The Villages, FL (47 miles) — separate pages, separate profiles, because their housing and weather records are their own. Homeowners near the boundary sit between two datasets; the ZIP list above, not the map's edge, decides which page was written about your stock.
Set Orlando among its neighbours and the contrasts sharpen the profile: Palm Bay–Melbourne, FL — metro population 663,982, median build year 1987 — sits 41 miles away; Lakeland, FL (874,790, median 1991) 44 miles; The Villages, FL (157,772, median 2005) 47 miles. Three different housing stocks under three nearby skies, which is why each keeps its own page and its own problem ranking rather than borrowing this one.
Ratios tell the metro's story compactly. Renters occupy 36.8% of homes; owners hold the rest. For every home built since 2000 there are 0.6 from before 1980. Spread the stock across the coverage map and each ZIP code carries about 11,672 housing units — the density at which era patterns repeat street after street instead of scattering, and at which a routed round of calls stays inside a few districts.
One line of Orlando arithmetic — a median home 32 years old · 622,610 owner-occupied homes against 362,532 renter-occupied · 875 pre-1960 homes for every covered ZIP code · a heating-to-cooling degree-day ratio of 0.13 · 1,307 mm of rain in an average year.
Before an emergency, read the guide: How to shut off your home's water main
Describe the problem and the call center routes you to an independent local plumber who works in the Orlando metro.
Call center hours: Mon-Fri 7:00 AM-10:00 PM ET | Sat 8:00 AM-10:00 PM ET | Sun 7:00 AM-9:00 PM ET