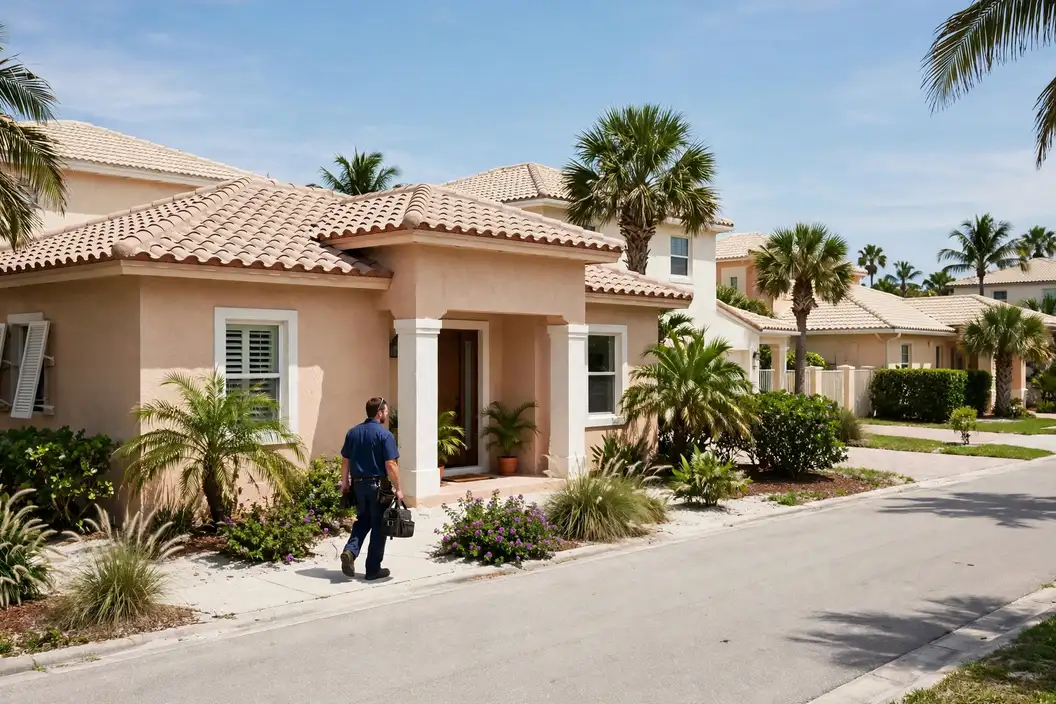


Start with the stock, and the rest of the page follows: Daytona Beach's housing eras, its climate record at DAYTONA BEACH INTL AP, FL US, and the failure patterns those two manufacture together — ranked, evidenced and answered below. When the pattern matches your home, one call routes you to an independent local plumber who works these streets.
Call center hours: Mon-Fri 7:00 AM-10:00 PM ET | Sat 8:00 AM-10:00 PM ET | Sun 7:00 AM-9:00 PM ET
The median Daytona Beach home was built in 1988; 30.9% of the stock predates 1980, and the pattern this metro's own data ranks first is slab leaks under concrete foundations. PlumbReach USA is a referral service, not a plumbing company: one call connects you with an independent local plumber serving your ZIP code.
Daytona Beach is a metro of 689,939 people and 287,692 households, and its plumbing is a portrait of its building history. The median home here was built in 1988; 30.9% of homes predate 1980 and 9.2% predate 1960, while 31.2% have arrived since 2000. Every one of those eras plumbed differently — different pipe materials, different drain designs, different fixtures — and they fail differently, which is why this page is organised around the patterns the data actually produces in Daytona Beach rather than plumbing in the abstract.
By now, most of Daytona Beach's pre-1980 homes are on their second plumbing lives in part: a heater replaced, a bathroom renewed, a section of drain renewed after a failure — while the remainder of the original system carries on into its sixth and seventh decades. The 103,939 homes in that stock are therefore not uniformly old; they are individually old, each with its own archaeology of repairs. That is why the pre-1980 districts reward inspection over inference: the street's average says little about the house in front of you, whose real history is written under its floors.
The growth side of the metro tells the opposite story in the same language. Palm Coast, Daytona Beach and the subdivisions still filling in account for much of the 104,948 homes built since 2000 — plastic supply lines, plastic drains, cartridge fixtures, slab foundations. Their plumbing is not old; it is uniform, which creates its own calendar: everything installed in the same boom reaches each wear point in the same years, from the first water-heater replacements to the first slab-leak scares, while 3,112 cooling degree days of annual heat keep demand on the system high.
One more record sits over the whole metro, and it is the one the pipes themselves keep: the weather's. DAYTONA BEACH INTL AP, FL US logs 51.25 inches of precipitation in an average year and swings between 65.3 days at 90 degrees or more and 3.0 nights at or below freezing. Buried lines ride that swing in the soil; heaters ride it in their cycle counts; exposed runs ride it at the extremes. Cross the swing with the housing ages above and the selection of problems further down this page stops looking like a list and starts looking like an arithmetic result.
Two public records, one metro: what was built here, and what the sky does to it.
Lay the eras side by side instead: 9.2% pre-1960 (30,946 homes), 21.7% from 1960-1979 (72,993), 37.9% from 1980-1999 (127,485), and 31.2% since 2000 (104,948). No single era tells the story — the proportions among them do, and those proportions are different in every metro this site covers.
Homes from 1980 to 1999 form Daytona Beach's largest band, and they set its plumbing agenda: copper supply lines entering their pinhole years in places, plastic drains still sound, first-generation cartridge fixtures wearing out in waves, water heaters on their second or third cycle. It is a stock past its carefree decades and into its maintenance decades — the era where watched systems keep lasting and unwatched ones start presenting their accounts in the form of leaks.
The second-largest band is the newest: 104,948 homes built since 2000, 31.2% of the metro. Young stock writes young plumbing — heater waves, cartridge waves, the first slab questions — arriving street by street as uniform subdivisions age in lockstep around Palm Coast and the growth edge. It is the metro's future workload, visible early to anyone reading the table.
No profile of this metro is complete without its extremes, because plumbing meets the extremes, not the averages. The average year at DAYTONA BEACH INTL AP, FL US — 71.5 degrees, 51.25 inches of precipitation — is a statistical resident of a metro nobody lives in. The lived version is the coldest night of January against an uninsulated run, the storm week that saturates the soil over every lateral, the August stretch that works heaters and drains without a pause. The numbers in this section are the averages; the problems ranked below are the extremes, translated.
That is the whole method of this page in one section: era shares from the Census, loads from NOAA, and a problem list that is simply where the two overlap most in Daytona Beach. The services and guidance that follow are ordered by the same profile — local first, generic last.
Sequenced by this metro's own problem ranking, not by a national catalogue order.
The expensive leaks are the quiet ones: a pinhole misting inside a wall, a slab line weeping into the ground for months. Finding them is a measurement exercise — meter behaviour, acoustic listening, pressure isolation — that narrows a whole house down to a square foot before a single board is lifted.
The water bill is usually Daytona Beach's first leak alarm. With 287,692 households on the meter across the metro, a quiet leak inside one home's walls still registers — a climb with no change in habits, a meter that moves at 3 a.m. Detection here is methodical because the housing varies: a slab home near Deltona, a pier-and-beam older house near the centre and a two-storey newer build each hide water differently, and the plumber chooses listening, isolation or moisture tools to match the construction in front of them. The 51.25 inches of rain in an average year here is part of the story too — buried lines feel every wet season.
Scale the problem by the Census count and it stays concrete: 336,371 housing units, each a small network of pressurised lines, each capable of losing water silently. The meters across Daytona Beach register those losses in aggregate; the detection visit exists to assign one of them to one address — in Palm Coast this month, somewhere else next.
The supply system is a single organism, so its failures correlate. Repiping exists for the point where correlation is obvious: pressure fading, water discolouring, leaks touring the house. New runs go in PEX or copper, routed to minimise opening walls, pressure-tested before anything is closed up.
Homes in Daytona Beach ask the repair-or-repipe question in a particular order. First one leak, repaired. Then another, in the same material, a year later. Pressure meanwhile declines across every fixture, and the water runs discoloured after the house sits quiet. That sequence — which plays out across the metro's pre-1980 housing especially — is the material delivering its verdict, and repiping in PEX or copper is the answer that ends the sequence rather than extending it by one more interval. Ask in Port Orange and the answer rhymes with Deltona: same eras, same materials, same calendar of failures.
The repair-or-renew caseload is set by one figure above the rest: 30.9% of Daytona Beach homes predate 1980, plumbed in the materials now at the end of their service lives. Around Port Orange (63,818 residents) as in the old core, that percentage is not an abstraction — it is the street's plumbing, house by house.
Roots, offsets, bellies, corrosion — the camera distinguishes them, and each has a different remedy at a different scale. That is the whole logic of sewer work: see the line first, then decide whether it needs a clearing, a section, or a new run entirely.
Consider the lateral as the home's only road out: every drain, every flush, every appliance discharge travels it. In Daytona Beach's older districts that road was built generations ago, in sections, and it has been subsiding, rooting and corroding on its own schedule ever since. The sewer visit surveys the road before recommending anything — its material, its slope, where it is broken versus merely blocked — because the remedies differ by an order of magnitude and the footage, not the symptom, is what separates them. A cleared symptom on a broken road is a postponement, and local plumbers here give their advice accordingly: honestly, from the camera's evidence. From Palm Coast to Daytona Beach, the pattern repeats wherever the housing era matches.
Sewer demand follows the founding map: the districts built first, around the old centre and out through DeLand, hold the jointed clay and iron; the growth rings hold plastic with decades in hand. 9.2% of the metro's homes stand on the founding side of that line, which is why the footage here so often shows a pipe at the end of its story.
Everything hot in a house — showers, laundry, dishes — passes through one tank, which is why its failures empty the whole routine at once. Servicing covers the wearing parts and the safety valve; installation work sets its successor up level, vented, drained and strapped, ready for its own decade of mornings.
Replacement season in Daytona Beach is not really a season — it is a wave, set decades ago. The heaters installed across the metro's building booms reach the end of their working lives in the same years, so whole streets of similar-aged homes swap tanks within a few seasons of each other. The 104,948 homes built since 2000 are entering the front of that wave now; the pre-1980 stock, on its second or third unit, is deep in it. Wherever a home sits in the wave, the judgement call is the same: repair the part or retire the tank, made on the tank's condition rather than its birthday alone. Locally the workload concentrates where the stock is oldest — the districts built around the 1980s first.
The arithmetic behind the diary: 287,692 households heating water through 3,112 cooling degree days and 708 heating degree days a year — every one of those households a tank ageing on the same climate's schedule, from the pre-war homes to the newest builds around Edgewater.
In Daytona Beach the emergency call is routed, not queued: one number reaches the independent local plumber covering Flagler, Volusia at that hour, and the housing record on this page — median build year 1988 — is the homework they arrive already knowing.
Drain work in Daytona Beach splits by era: the 103,939 pre-1980 homes drain through older materials, the post-2000 subdivisions through plastic — and the local plumber reads the cable's return to tell which world your street drains through.
Running, rocking or refusing — in Daytona Beach the diagnosis is the same short sequence: fill valve, flapper, supply line, flange. The plumbers routed here carry the internals for the fixtures this metro's eras installed.
Fixture work in Daytona Beach divides by era like everything else on this page: washer-era taps in the older districts, cartridge internals in the post-2000 subdivisions — the local plumber stocks for both.
If this page's services were ranked by Daytona Beach's call patterns rather than listed in catalogue order, they would come out much as they do here — because the ranking behind them is data, not habit. Slab leaks under concrete foundations leads the metro's problem table and galvanized pipes at the end of their life follows, so the services answering them lead the list. The long tail of a metro's plumbing life — fixture failures, toilet calls, the single unexplained leak — fills in the diary around them, here as everywhere.
Chosen by this metro's own housing and weather data — the same two records this whole page is built from.
Homes built on concrete slabs carry their water lines beneath or within that slab, and in Daytona Beach that describes a large share of the housing stock: 31.2% of homes were built after 2000 and much of the building boom before it used slab foundations too. When a pressurized line under a slab develops a leak, the water has no visible place to go. It warms a patch of floor from below, works into the soil under the foundation, raises the water bill steadily, and in time can undermine the slab's support. The clues are quiet ones — a warm spot on tile, a bill climbing with no change in habits, the faint sound of running water in a silent house. Detection equipment listens through the slab and pinpoints the line and the leak, which turns the repair into a choice with real options: open the floor at the marked point, or abandon that run and reroute the line through the walls and ceiling above, leaving the slab untouched. Which route suits depends on where the leak sits and how many lines share the run — a plumber who has heard the leak through the concrete can lay both out plainly.
The cruel arithmetic of a slab leak is that time is water. A pinhole under concrete does not drip into a bucket; it saturates the ground, swells what can swell, and bills the household for every gallon. Weeks of it can pass between the first warm patch on the floor and the diagnosis, which is why the meter test matters so much in Daytona Beach's slab districts: ten minutes with every tap closed tells a household whether its concrete is hiding something, long before the floor itself confesses.
Slab construction is the growth pattern of the newer Daytona Beach: much of the 104,948 homes built since 2000 sit on concrete slabs with their water lines underneath, and every year of soil movement and hot-water cycling works on those buried runs. A leak there does not announce itself with a puddle — it shows up in the water bill, a warm patch of floor, or the meter that will not sit still at night.
There is a diagnostic shortcut for galvanized systems, and it is a white bucket. Fill it at a tap after the house has sat quiet overnight: the first draw runs tea-coloured with the rust the lines have shed, clearing as fresh water arrives. It is a small experiment with a large meaning — the pipe's interior is dissolving into the water it carries. Across Daytona Beach, homes plumbed in the galvanized decades run that experiment daily whether they look at the bucket or not. One home's result is a curiosity; the same result with falling pressure and returning leaks is the material's resignation letter.
Galvanized pipe fails politely, which is precisely the problem. No flood, no drama — just a shower that weakens across years, a washing machine that fills slowly, water that blushes rust after holidays. Households adapt without noticing, the way you adapt to a dimming bulb. The 72,993 homes built in this metro between 1960 and 1979 stand in the front of that queue now, their original steel bores narrowed to drinking-straw width in the worst runs. The fix, when it comes, tends to astonish people — not with its scale, but with the pressure they had forgotten they were owed.
In raw numbers, Daytona Beach's exposure is 103,939 homes built before 1980 — the galvanized decades. Behind every one of those front doors is the same material on the same clock, which is why pressure complaints and pinhole leaks cluster by neighbourhood here rather than scattering evenly across the metro.
A lateral ages in the dark, at the pace of the ground around it. Soil creeps; bedding washes grain by grain toward the street; joints laid generations ago in Daytona Beach's older districts step a fraction out of true and stay there, catching what the household sends down. Nothing about this is dramatic from inside the house — until the day the accumulated fractions add up to a line that no longer falls cleanly to the main. That day announces itself downstairs, at the ground-floor fixture, the way it always has: the private sewer reporting, at last, in public.
A lateral gives decades of silence and then a short conversation. The conversation usually starts with the ground-floor drain in the house and escalates through the cleanout to the camera — and the camera's footage settles every argument about whether the line is blocked or broken. Across Daytona Beach, the laterals entering that conversation now are the ones buried when the metro's median home went up, in 1988. They were built to outlast their mortgages, and they have; the question the footage answers is how much further the same pipe can honestly be asked to go.
The census figures draw the map: 30,946 homes from before 1960 and a median build year of 1988 mean the typical lateral in Daytona Beach has been buried for decades, and the oldest have passed the service life their materials were expected to give. Multiply one buried line by 336,371 housing units and the pattern's rank on this page stops being surprising.
A water heater under strain complains in a consistent order. First the recovery slows: back-to-back showers end in a lukewarm truce. Then the noises begin — sediment on the tank floor superheating pockets of water into small, kettle-like pops. Then the pilot or the elements start their intermittent failures. In Daytona Beach the strain is structural: 3,112 cooling degree days of demand against 708 heating degree days of cold inlet water, cycling the metro's tanks without an off-season. Servicing interrupts the order at whichever stage it has reached; the tank's age and the sediment's depth decide whether the interruption is a repair or a retirement.
A water heater's enemies compound quietly. Sediment settling on the tank floor insulates the water from the burner or elements, so the unit fires longer to do the same work; the longer firing expands and contracts the tank steel, working the lining; the anode rod, designed to corrode in the steel's place, spends itself a little faster with every cycle. None of this announces itself until recovery slows — showers running lukewarm in sequence, a rumble from the tank as steam pockets form in the sediment — and by then the arithmetic of age has usually been running for years. Homes in Daytona Beach put real hours on these appliances: hot water is not a seasonal luxury here but a year-round daily load, and the fleet of heaters across the metro ages in step with the housing that holds it.
The demand side, from the Census: 287,692 households, most heating water daily, in a metro where the hot season runs long and the cold snaps are sharp. Appliance populations that large, worked that hard, fail on a distribution — and the distribution's peak is what a ranking like this one is measuring.
When a storm system pushes through Daytona Beach, the plumbing load arrives as water: saturated ground pressing on laterals, storm runoff testing every joint, and households running everything at once once the weather clears. The homes that ride the season out well are the ones whose drains were clear before it started — a line at half capacity in June is a backup in September.
When the storms come, Daytona Beach's plumbing meets them in the ground: laterals under saturated soil, cleanouts under standing water, ground floors at the level the water is looking for. The season tests the buried half of every system here, and it tests the older districts — where the lines are jointed clay and iron — hardest of all. Preparation is unglamorous and specific: know the cleanout, know the shutoff, know the ground-floor drain in the house.
Consider where the water goes. A supply line pierced under a slab does not announce itself in the room above; it irrigates the ground the house stands on, sometimes for a season, and the house reports it sideways — flooring that cups, a baseboard that darkens, a gas bill that climbs as the heater feeds the leak's appetite for hot water. Daytona Beach's slab-built stock — the tracts around Deltona and the 104,948 homes poured since 2000 — holds this risk in common: same design choice, same concealment. The metro's older pier-and-beam homes leak too, but they leak visibly, into crawl spaces, where a flashlight finds them. The slab keeps its secret until somebody goes listening for it.
Strip the pattern down to its inputs and the ranking stops being mysterious: 287,692 households drawing on systems installed across a median build year of 1988, in a climate that swings between 65.3 days of serious heat and 3.0 freezing nights. Whatever pattern a metro with those inputs manufactures most, it manufactures here — the lead position is less a title than a consequence, recalculated from the same public records any sceptic can check.
On a first visit for this pattern, a local plumber's checks run in a practised order:
 PROBLEM
 SOLUTION
Population 95,682
Population 94,362
Population 75,924
Population 63,818
Population 43,514
Population 39,832
Population 31,212
Population 23,314
Population 22,602
Population 13,768
Population 13,322
Population 13,002
Also in the Daytona Beach metro: Ormond-by-the-Sea (population 6,962), Flagler Beach (population 5,250).
Beyond Deltona itself, the metro takes in Palm Coast (94,362 residents), Daytona Beach (75,924) and the rest of the communities in the grid above — each plumbed in its own building era, which is why two streets in the same metro can need entirely different plumbing conversations. The ZIP list below is the full coverage footprint: if your code is on it, this page was written about your housing stock.
Also on the Daytona Beach map: Port Orange (63,818), Ormond Beach (43,514), DeLand (39,832), New Smyrna Beach (31,212), Edgewater (23,314) — communities spread across Flagler, Volusia, each with housing from its own growth years. A plumber routed through PlumbReach USA to any of them is working from this same page: the metro data does not change at the city limit, but the housing on your street — its age, its materials, its soil — is what the visit is really about.
Deltona (95,682 residents) anchors the metro, and Palm Coast (94,362) is its second centre of gravity. Between them they hold the bulk of the 287,692 households — and, not coincidentally, the bulk of every housing era this page discusses, from the pre-1960 core to the newest subdivisions. Daytona Beach (75,924) and the communities beyond it repeat the same eras at smaller scale.
The metro answers to 2 county governments (Flagler, Volusia), a patchwork that matters at permit time rather than at the pipe. Flagler County carries the centre; the others carry the growth rings and the older outlying towns. A plumber routed through this page works inside that patchwork daily — the water does not care about the boundaries, but the job's paperwork does.
Three neighbouring coverage areas begin where this one ends: Ocala, FL, some 50 miles off; Orlando, FL, 53 miles; and The Villages, FL, 64 miles. Each keeps its own page because each keeps its own numbers — a different median build year, a different climate station, a different problem ranking. Boundary households should trust the ZIP list over the map: the code, not the compass, assigns the dataset.
Set Daytona Beach among its neighbours and the contrasts sharpen the profile: Ocala, FL — metro population 442,660, median build year 1992 — sits 50 miles away; Orlando, FL (2,957,672, median 1994) 53 miles; The Villages, FL (157,772, median 2005) 64 miles. Three different housing stocks under three nearby skies, which is why each keeps its own page and its own problem ranking rather than borrowing this one.
The stock has a shape as well as a size. Owners hold 74.3% of it and renters 25.7%, a split that decides who notices a drip first and who arranges the repair. The generations split 1.0-to-one in favour of the pre-1980 homes. And the map divides into 14 named communities across Flagler, Volusia, each carrying its era's share of the 336,371 housing units the Census counts here.
The Daytona Beach record in one line — median home age: 38 years · owner-occupied homes: 213,755 · renter-occupied homes: 73,937 · pre-1960 homes per covered ZIP code: 998 · heating-to-cooling degree-day ratio: 0.23 · average rainfall: 1,302 mm a year.
Before an emergency, read the guide: How to shut off your home's water main
PlumbReach USA routes your call to an independent local plumbing professional serving Daytona Beach — the assessment and the work are theirs.
Call center hours: Mon-Fri 7:00 AM-10:00 PM ET | Sat 8:00 AM-10:00 PM ET | Sun 7:00 AM-9:00 PM ET