This is Charleston's plumbing page, built from Charleston's own numbers: Census housing figures, the metro's ZIP codes and its NOAA climate record. PlumbReach USA routes your call to an independent local plumber; the homework below is here so you know your home's likely problems before you ever make it.
Call center hours: Mon-Fri 7:00 AM-10:00 PM ET | Sat 8:00 AM-10:00 PM ET | Sun 7:00 AM-9:00 PM ET
84
ZIP codes covered
3
Counties in the metro
87,660
Households (Census ACS)
1968
Median year home built
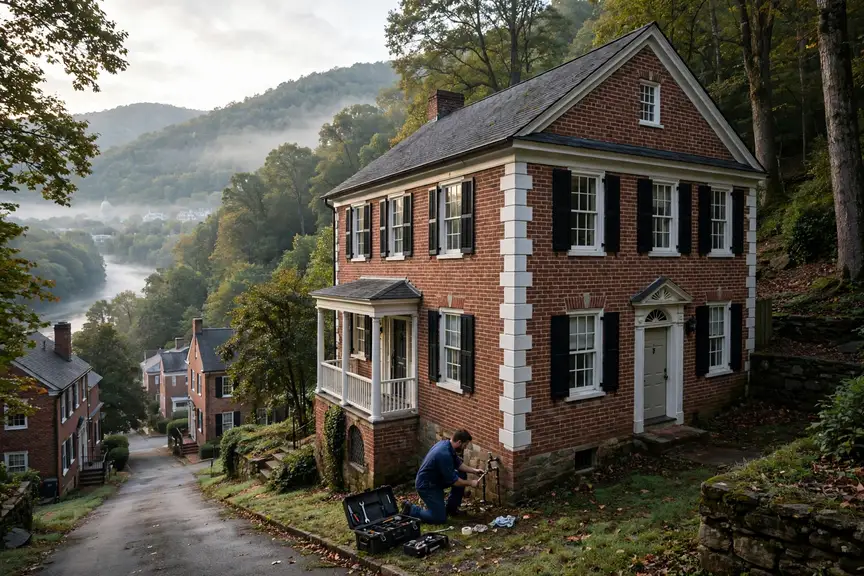
Charleston, WV — plumbing help across the metroLocal plumbers serving Charleston neighbourhoodsReplacing a heater in a Charleston home
Charleston plumbing, in brief
The median Charleston home was built in 1968; 68.1% of the stock predates 1980, and the pattern this metro's own data ranks first is ageing cast iron sewer lines. PlumbReach USA is a referral service, not a plumbing company: one call connects you with an independent local plumber serving your ZIP code.
The Charleston housing stock, and what it means for plumbing
Read Charleston through its counties and the picture sharpens. Boone, Clay, Kanawha were not built in the same decades or for the same households, and their plumbing carries those differences: an older core where 41.1% of the metro's homes predate 1960, growth corridors where the subdivisions arrived in waves, and edges still being built out. The metro-wide medians — a middle home built in 1968, 104,500 housing units in all — are the average of those local stories, and the sections below are organised by the patterns the combined record produces, from the oldest pipe materials to the newest failure modes.
There is a materials timeline buried in Charleston's housing figures, and it reads like a plumber's diary. The 42,950 homes from before 1960 were drained in cast iron or clay and supplied, in many cases, in galvanized steel. The 28,215 that followed between 1960 and 1979 mixed those materials with early copper. Then came the 21,109 homes of 1980-1999, plumbed increasingly in copper and early plastics. Each band of that timeline is now a band of characteristic failures, arriving in the order the materials tire — which is why a home's build year, in this metro, is the single most predictive fact about its plumbing.
There is a second way to read the growth figures: as a maintenance wave still approaching. The 12,226 homes built since 2000 were handed over with everything new at once — heaters, cartridges, supply lines, seals — and new things age in convoy. The first replacements in those subdivisions have begun; the wave behind them is arithmetic. Households in South Charleston and the other growth districts who learn their systems now, while the systems are still young, are the ones who will meet that wave as a schedule rather than a surprise.
Over the housing sits one more dataset, the sky's: 4,353 heating degree days and 1,162 cooling degree days in the average year at CHARLESTON YEAGER AP, WV US, an average temperature of 56.1 degrees, extremes at both ends faithfully recorded. A metro's plumbing is designed — to the extent it is designed at all — for the middle of that record, and it fails at the record's edges. What follows is a page about the edges: the cold snaps, the storm weeks, the long hot stretches, and the systems they find first.
The Charleston plumbing profile in numbers
Two public records, one metro: what was built here, and what the sky does to it.
The distribution, in one breath: of every hundred Charleston homes, 41.1 were standing before 1960, 27.0 went up in the two decades after, 20.2 in the two after that, and 11.7 have arrived since 2000. Percentages flatten the picture, so hold the counts beside them — 42,950 oldest-era homes, 12,226 newest — and the metro's plumbing stops being an abstraction: it is that many systems, of those ages, failing in that order.
This is, by the numbers, an old-system metro. The largest slice of its housing predates 1960, which means the typical serious job here involves materials in their seventh decade or beyond: drains of cast iron or clay, supply runs in galvanized steel, laterals laid when the streets themselves were young. The newer bands exist — the growth since 2000 is real — but they are the supporting cast. Charleston's plumbing identity was fixed by its earliest builders, and its problem list is written in their materials.
Close behind the leader come the 1960-1979 homes, 27.0% of the stock. Their plumbing is mid-change by construction — the decades when materials swapped over mid-stream — so this band is where a Charleston plumber earns the diagnostic fee: pressure tests and camera runs that say which side of the transition a given house was built on.
A profile needs its climate column, and Charleston's comes from CHARLESTON YEAGER AP, WV US: an average year of 56.1 degrees, built from extremes at both ends. The heating load (4,353 degree days) and the cooling load (1,162) together set the water heater's working life; the precipitation total (46.24 inches) sets the soil's behaviour around every buried line; the freeze count (94.3 nights) sets the exposure of every uninsulated run. Four numbers — and most of the metro's plumbing behaviour follows from them.
That is the whole method of this page in one section: era shares from the Census, loads from NOAA, and a problem list that is simply where the two overlap most in Charleston. The services and guidance that follow are ordered by the same profile — local first, generic last.
Plumbing services in Charleston
Sequenced by this metro's own problem ranking, not by a national catalogue order.
Sewer Line Repair & Replacement in Charleston
Of all a home's pipes, the sewer lateral works under the worst conditions: buried, jointed, rooted at, and loaded by every fixture in the building. Its care begins with seeing it — a camera run that records material, slope and damage — and proceeds by the footage's logic: clear what clearing cures, mend what is locally broken, renew what has failed along its length. No stage of that is guesswork, and the homeowner sees the same footage the plumber does.
The case for camera-first sewer work is written in this metro's building history. Charleston's laterals run in clay, iron, early plastic and modern plastic depending on the decade of the street — four materials with four failure styles and four different correct repairs. Treating them as one material invites the classic error: clearing a collapsed clay line as though it were a blocked plastic one, and booking the household for a repeat performance. The survey removes the guesswork at the start, when it is cheapest to remove, and every recommendation that follows can point to footage rather than opinion. Locally the workload concentrates where the stock is oldest — the districts built around the 1960s first.
Sewer demand follows the founding map: the districts built first, around the old centre and out through South Charleston, hold the jointed clay and iron; the growth rings hold plastic with decades in hand. 41.1% of the metro's homes stand on the founding side of that line, which is why the footage here so often shows a pipe at the end of its story.
The supply system is a single organism, so its failures correlate. Repiping exists for the point where correlation is obvious: pressure fading, water discolouring, leaks touring the house. New runs go in PEX or copper, routed to minimise opening walls, pressure-tested before anything is closed up.
Repiping reads as a dramatic word for what is, in Charleston's older districts, a routine chapter of homeownership — the point where a material that served two generations hands over to one that will serve the next two. The metro's figures say how routine: 68.1% of homes predate 1980, and every one of them is running supply lines from a shorter-lived era. The households that handle the chapter well treat it as scheduling rather than crisis: evidence gathered, routes planned through the accessible spaces, water staged back on room by room. What they retire is not just pipe but a pattern of small failures. In Charleston that holds across 84 ZIP codes, from Charleston out to St. Albans.
The repair-or-renew caseload is set by one figure above the rest: 68.1% of Charleston homes predate 1980, plumbed in the materials now at the end of their service lives. Around Cross Lanes (10,172 residents) as in the old core, that percentage is not an abstraction — it is the street's plumbing, house by house.
In Charleston the emergency call is routed, not queued: one number reaches the independent local plumber covering Boone, Clay, Kanawha at that hour, and the housing record on this page — median build year 1968 — is the homework they arrive already knowing.
Drain work in Charleston splits by era: the 71,164 pre-1980 homes drain through older materials, the post-2000 subdivisions through plastic — and the local plumber reads the cable's return to tell which world your street drains through.
From Charleston to Cross Lanes, the heater question is the same — repair the unit or renew it — and the honest answer starts from its age against Charleston's demand record, which this page sets out.
A creeping meter in a Charleston home is located, not guessed at: the professionals routed here trace the line with instruments and confirm the spot before any floor or wall is opened.
Running, rocking or refusing — in Charleston the diagnosis is the same short sequence: fill valve, flapper, supply line, flange. The plumbers routed here carry the internals for the fixtures this metro's eras installed.
Faucet, Fixture & Garbage Disposal Repair in Charleston
Fixture work in Charleston divides by era like everything else on this page: washer-era taps in the older districts, cartridge internals in the post-2000 subdivisions — the local plumber stocks for both.
Bookings in this metro have a centre of gravity, and it sits on the two patterns this page ranks first: Ageing cast iron sewer lines, then galvanized pipes at the end of their life. Everything a local service operation does — the vans' stock, the week's scheduling, the order of this very list — bends around that gravity. A homeowner reading the services above is therefore reading something more specific than a menu: a forecast of what a home like theirs, in a metro built like this one, is most likely to need, in the order it is most likely to need it.
Plumbing problems Charleston homes actually get
Chosen by this metro's own housing and weather data — the same two records this whole page is built from.
Ageing cast iron sewer lines
Cast iron was the standard sewer material for homes built through the middle of the last century, and Charleston still has a great deal of it underground: 41.1% of homes here were built before 1960 and 68.1% before 1980. Cast iron does not fail all at once. It corrodes from the inside out, the bottom of the pipe thinning and scaling until waste catches on the rough surface, and a line that drained freely for decades starts slowing, then backing up. By the time roots find the joints of an old cast iron line, the pipe wall around them is often too thin for cleaning alone to be the whole answer. A camera inspection shows exactly how much good pipe is left: scaling near the top of the line may clean up well, while a channel rotted along the bottom means that section is living on borrowed time. Homeowners in Charleston with a pre-1960 house and drains that misbehave through the whole home — not just one fixture — are usually looking at this story, and the sensible first step is a camera look before another cleaning is booked.
There is a temptation to judge an old drain by its kindest day. On its kindest day it still clears, still serves, still seems to argue for another year. Judge it instead by its trend: clearings that come closer together, a tub that drains slower each season, a smell that returns after rain. In the 42,950 pre-1960 homes across this metro, that trend is the pipe's biography being read aloud — corrosion does not pause between visits, and the homes that fare well are the ones whose owners believed the early chapters.
Another way to size the exposure: Charleston's pre-1960 homes — roughly 42,950 of them — were plumbed in an era when cast iron was not a choice but the standard. Their drains have now spent sixty-plus winters and summers expanding, contracting and carrying loads their installers never pictured, which is why this pattern outranks problems that belong to younger housing.
Watch for
Floor drains in the basement or ground floor backing up during heavy use
A sewer smell near drains that cleaning does not shift
Patches of lawn staying green or soggy over the line's path
The galvanized story can be told at a single tap. Open the fixture farthest from the meter in a Charleston home still on its original steel and watch the stream: respectable for a moment, then thinning as the narrowed runs upstream ration the flow. That rationing is the material's old age made visible — decades of internal rust taxing every gallon. The metro holds 71,164 pre-1980 homes, and in the ones never repiped, the tax rises yearly. Unlike most plumbing failures, this one is perfectly forecastable: the tap has been reporting it, patiently, for years.
The geography of galvanized failure inside one house is uneven, and the unevenness misleads people. The runs nearest the water heater corrode fastest, worked by heat; long horizontal runs narrow differently from vertical risers; the line to a little-used guest bathroom may be nearly closed while the kitchen still flows. This is why a Charleston home can seem fine at most taps while one shower has given up entirely. Repiping answers the whole geography at once, which is its real argument: not that any single run has failed, but that the system's remaining life is scattered unevenly through every wall, and spot repairs keep buying the shortest-lived section.
In raw numbers, Charleston's exposure is 71,164 homes built before 1980 — the galvanized decades. Behind every one of those front doors is the same material on the same clock, which is why pressure complaints and pinhole leaks cluster by neighbourhood here rather than scattering evenly across the metro.
Water expands as it freezes, and a pipe gives it nowhere to go. The split rarely announces itself in the cold — it waits for the thaw, when pressure returns and the crack opens into a spray inside a wall, a ceiling or a crawl space. The lines that go are predictable: runs through exterior walls, garages, crawl spaces and any stretch the heating never reaches, in homes plumbed before routing pipes through conditioned space became the habit. One hard night is enough; the damage is done by the thaw, and it is usually discovered by the sound of running water in a quiet house or a stain spreading across a ceiling that was dry at breakfast.
Prevention, for this pattern, is a geography lesson: the burst never happens in the middle of the heated house. It happens at the perimeter — the wall cavity on the windward side, the run beneath the addition, the pipe the builder routed through the garage to spare six feet of copper. In Charleston, where 23.6 summer days tempt everyone to forget what 94.3 freezing nights intend, the autumn ritual is short and specific: find every line that leaves the warmth, and do something about it. The households that keep that ritual read about burst pipes the way other people do — as news.
Local exposure, stated plainly: a large stock of homes plumbed before freeze protection was designed-in, standing in a climate that freezes on 94.3 nights a year. Either figure alone is unremarkable; together they describe a metro where burst lines are a seasonal category of call, not an anomaly.
Watch for
A tap that runs slower or stops during a cold snap, then returns
Frost or condensation on an exposed pipe in the garage or crawl space
A sudden drop in pressure, or the sound of water, as temperatures rise after a freeze
Winter in Charleston is pipe season. With about 94.3 nights a year at or below freezing on the long-term record, the houses that get through winter cleanly are the ones whose exposed lines were dealt with in autumn: insulation on garage and crawl-space runs, hoses off the outside taps so those lines can drain, and a household that knows where its main shutoff is before it needs it. During the hardest cold, a slow drip from the tap furthest from the main and open cabinet doors under sinks on outside walls are simple insurance. If a line does freeze, shut the water off before the thaw does its damage and have the run checked — a pipe that froze once has shown you exactly where it is vulnerable.
The numbers behind the season here: 94.3 nights a year at or below freezing at CHARLESTON YEAGER AP, WV US, against a housing stock whose median build year is 1968. Every winter writes the same exam for Charleston's older pipes, and every winter some of them — usually in the the 1960s districts first — fail it.
A closer look: ageing cast iron sewer lines in Charleston
The telltale geography here is generational. Cast iron under a Charleston street means the street predates the metro's plastic era — the blocks around Charleston first, the early suburbs second, almost nothing built after the material left standard practice. A homeowner in those blocks owns a drain in its eighth or ninth decade, and the diagnostic question is never whether the iron has corroded — it has — but how far the corrosion has travelled: a section, a run, or the whole line to the street. Cameras answer it street by street, house by house, and the answers in the oldest blocks rhyme closely enough that experienced local plumbers can often predict the footage before they see it.
Read the ranking backwards and it reads as a data summary: 207,456 residents in 104,500 housing units, 41.1% of the housing from before 1960, 46.24 inches of rain in an average year. The pattern leads because the exposure is broad — counted not in individual unlucky houses but in whole eras of the metro's building, stacked one on another.
On a first visit for this pattern, a local plumber's checks run in a practised order:
The ground-floor fixtures first — a main-line problem reports there before anywhere else
The age and material of the line, from the home's era and any past camera reports
Whether gurgling tracks the washing machine's discharge — a classic main-line signature
The cleanout's cap and condition, and whether it has ever been opened
From problem to fixed, in Charleston
PROBLEMA plumbing problem inside a Charleston home
➔
SOLUTIONThe same system in Charleston after professional repair
Areas covered in the Charleston metro
Charleston
Population 47,918
South Charleston
Population 13,594
St. Albans
Population 10,637
Cross Lanes
Population 10,172
Dunbar
Population 7,340
Nitro
Population 6,941
Pinch
Population 3,893
Madison
Population 2,840
Sissonville
Population 2,706
Chesapeake
Population 1,615
Belle
Population 1,537
Marmet
Population 1,520
Also in the Charleston metro: Alum Creek (population 1,472), Coal Fork (population 1,414).
Read the grid as a building programme spread over a century. The oldest communities sit where the metro began; the youngest are still adding streets at its edge; and South Charleston and St. Albans, with 13,594 and 10,637 residents, stand for the rings in between. Each ring plumbed in its era's materials, and each is now failing, wearing or holding in its era's characteristic order. The ZIP codes below draw the coverage boundary; the eras inside it draw everything else on this page — the problems ranked, the services ordered, the checks advised.
Also on the Charleston map: Cross Lanes (10,172), Dunbar (7,340), Nitro (6,941), Pinch (3,893), Madison (2,840) — communities spread across Boone, Clay, Kanawha, each with housing from its own growth years. A plumber routed through PlumbReach USA to any of them is working from this same page: the metro data does not change at the city limit, but the housing on your street — its age, its materials, its soil — is what the visit is really about.
Charleston (47,918 residents) anchors the metro, and South Charleston (13,594) is its second centre of gravity. Between them they hold the bulk of the 87,660 households — and, not coincidentally, the bulk of every housing era this page discusses, from the pre-1960 core to the newest subdivisions. St. Albans (10,637) and the communities beyond it repeat the same eras at smaller scale.
Draw the metro by its paperwork and it resolves into Boone, Clay, Kanawha — 3 jurisdictions sharing one housing stock and one weather system. Boone County holds the historic centre and the densest share of the older homes; the surrounding counties hold the rings of growth around it. Permits and inspections follow those boundaries even though water never does, which is part of why the plumber this page connects you to works these streets specifically.
Three neighbouring coverage areas begin where this one ends: Huntington, WV, some 61 miles off; Morgantown, WV, 123 miles; and Blacksburg, VA, 93 miles. Each keeps its own page because each keeps its own numbers — a different median build year, a different climate station, a different problem ranking. Boundary households should trust the ZIP list over the map: the code, not the compass, assigns the dataset.
The region around Charleston is a set of variations on its theme: Huntington, WV, 61 miles off, runs a median build year of 1976 on a metro population of 365,965; Morgantown, WV (123 miles) medians 1986 on 141,995; Blacksburg, VA (93 miles) medians 1981 on 181,616. Nearness is not sameness — a few decades of median build year separate their plumbing as surely as the miles separate their maps.
Divide the stock by the map and the densities appear: roughly 1,244 housing units for every covered ZIP code, 29,220 households to a county, 14 named communities in the grid. The balance between the generations reads 5.8 pre-1980 homes for every home built since 2000 — a single ratio that quietly predicts whether a metro's plumbing week leans toward renewal work in the old districts or first-generation upkeep in the new ones.
The Charleston record in one line — median home age: 58 years · owner-occupied homes: 62,502 · renter-occupied homes: 25,158 · pre-1960 homes per covered ZIP code: 511 · heating-to-cooling degree-day ratio: 3.75 · average rainfall: 1,174 mm a year.
Charleston plumbing questions
What area does PlumbReach USA cover around Charleston, WV?
Every covered community in the metro — 84 ZIP codes in total, spread over Boone, Clay, Kanawha. The largest share sits in Charleston, with South Charleston and St. Albans behind it, and the full list is printed on this page. Find your code there and the routing takes a single call. Put the coverage against the Census map and it tracks the population: Charleston first (23.1% of the metro), then the rings of suburbs and smaller communities in their own building decades — all of it inside the same routing. If a street sits between St. Albans and Cross Lanes, it is in; the list was drawn from the Census map of the metro — 3 counties, 84 codes — rather than from a radius around a shop. The ground inside that boundary holds 104,500 housing units — 42,950 from before 1960, 28,215 from 1960-1979, 12,226 since 2000 — under the climate record kept at CHARLESTON YEAGER AP, WV US. Stated as the communities it covers: the community ledger reads Charleston (47,918 residents), South Charleston (13,594), St. Albans (10,637), Cross Lanes (10,172) and Dunbar (7,340), out of 207,456 residents metro-wide.
If my Charleston, WV house dates to about 1968, where does a plumber look first?
Begin at the shutoffs and work outward. In a Charleston home of about 1968, the valves are the first honest reporters: ones that will not turn are telling you the system has not been exercised or serviced in years. From there, the watch-list is the water heater's age against its expected span, the supply lines' material where they are visible in the basement or crawl space, and any drain that has slowed by degrees. None of this requires opening a wall — it requires an hour, a torch, and the decision to look before the system insists on being looked at. In Charleston that plays out across 84 ZIP codes, from Charleston to South Charleston. The same watch-list runs metro-wide: from South Charleston (13,594 residents) to St. Albans (10,637) and Cross Lanes, across Boone, Clay, Kanawha, the 71,164 pre-1980 homes share the materials this answer describes — which is why a neighbour's leak two streets away is worth a homeowner's attention here. The same applies street by street in Boone County: a median year of 1968 is an average, and the homes on either side of it — older in the core, newer past Cross Lanes — read from the same materials list. Set against the climate that works on them — 4,353 heating degree days, 1,162 cooling degree days, 46.24 inches of rain at CHARLESTON YEAGER AP, WV US — the era of a Charleston home is the strongest single clue to the condition of its plumbing. Where the watching happens, in figures: the community ledger reads Charleston (47,918 residents), South Charleston (13,594), St. Albans (10,637), Cross Lanes (10,172) and Dunbar (7,340), out of 207,456 residents metro-wide — one timetable of ageing systems across all of them.
If Charleston, WV plumbers could prevent one problem, which would it be?
It is the pattern this page puts first: ageing cast iron sewer lines. Cast iron was the standard sewer material for homes built through the middle of the last century, and Charleston still has a great deal of it underground: 41.1% of homes here were built before 1960 and 68.1% before 1980. Prevention talk usually starts there as well, because the largest single source of callouts is the one where a watched home can actually change the ending — catching the early signs costs a house call, while catching the late ones costs a floor. The backdrop is the same metro-wide: 104,500 housing units working against the CHARLESTON YEAGER AP, WV US climate record. For scale, the runner-up is galvanized pipes at the end of their life, and the gap between them is the metro's own arithmetic: housing counted across Boone, Clay, Kanawha, weather logged at CHARLESTON YEAGER AP, WV US, and an era profile with a median of 1968. Change one input and the order moves: at CHARLESTON YEAGER AP, WV US the record reads 4,353 heating degree days against 1,162 cooling; in the stock, 41.1% predates 1960 and 68.1% predates 1980. The inputs behind the ranking, community by community: the community ledger reads Charleston (47,918 residents), South Charleston (13,594), St. Albans (10,637), Cross Lanes (10,172) and Dunbar (7,340), out of 207,456 residents metro-wide.
How does the Charleston, WV climate change what my plumbing needs?
Start at the roofline and work down. Rain — 46.24 inches in an average year at CHARLESTON YEAGER AP, WV US — loads the drains and the soil together. Heat works the heater and dries the traps. Cold tests the exposed runs and the shallow burials, 94.3 nights a year. A Charleston home does not have one plumbing climate; it has three, stacked by depth, and the problem list on this page is sorted by which layer each pattern lives in. The figures behind that answer, from the station record: a yearly average of 56.1 degrees, 46.24 inches of precipitation, 23.6 days at 90 or above and 94.3 nights at freezing or below — the four numbers this page's seasonal section is built from. It is the same story from South Charleston to St. Albans — the stock decides, and this stock's median build year is 1968. That is the metro-wide version; the household version differs by exposure — a shaded lot in South Charleston, an open slab in St. Albans (10,637 residents), a crawl space in Cross Lanes — but the loads themselves, 4,353 heating degree days against 1,162 cooling, are the same sky over every roof in Charleston. The figures are worth keeping with the house papers: 56.1 degrees as the yearly average at CHARLESTON YEAGER AP, WV US, 46.24 inches of precipitation, and a housing stock whose median year is 1968 — the three numbers this metro's plumbing lives by. The numbers in one line: 56.1 degrees average, 46.24 inches of precipitation, 4,353 heating degree days, 1,162 cooling degree days, 23.6 days at 90 or above, 94.3 nights at freezing or below. Whose roofs that weather works on: the community ledger reads Charleston (47,918 residents), South Charleston (13,594), St. Albans (10,637), Cross Lanes (10,172) and Dunbar (7,340), out of 207,456 residents metro-wide.
I can hear water running inside a wall at my Charleston, WV home. First move?
Kill the water at the main shutoff — where the line enters the house, in the basement, garage or utility space, or out at the meter box by the street. Then crack open a ground-floor tap to bleed the pressure off, keep everyone clear of water near electrics, and make the call. Our shutoff guide, linked from this page, shows how to find the valve on a calm day instead of a wet one. Across the metro's 3 counties, Boone County included, the pattern repeats wherever the housing matches. Where the valve lives in Charleston follows the build decade: the 71,164 pre-1980 homes shut off indoors or at a curb stop, the slab subdivisions toward Cross Lanes at the meter box — and CHARLESTON YEAGER AP, WV US's 94.3 freezing nights a year are why the calm-day search for it matters here more than in milder metros. The calm-day homework for this metro: walk the 84 covered ZIP codes' worth of housing in your mind to your own valve — in Boone County the older stock hides it indoors, the slab tracts past St. Albans at the meter — and turn it once before you ever need it in anger. The calm-day version, localised: find your valve before CHARLESTON YEAGER AP, WV US's next freeze season — 94.3 freezing nights a year — whether your home sits near Charleston, out in South Charleston (13,594 residents) or past St. Albans (10,637). True from the centre to the edge: the community ledger reads Charleston (47,918 residents), South Charleston (13,594), St. Albans (10,637), Cross Lanes (10,172) and Dunbar (7,340), out of 207,456 residents metro-wide — shutoff first, everywhere on the map. The ranking that frames the damage: Ageing cast iron sewer lines first on this page, galvanized pipes at the end of their life second, freeze-burst pipes in cold snaps third — the burst line in front of you belongs to the same local arithmetic. Learn it street by street if you must: the 25529 subdivisions shut off at the meter, the 25206 districts at the wall, the oldest homes out toward 25015 at a curb stop — the map of valves is the map of build decades.
Are older Charleston, WV homes more likely to need repiping?
Sometimes, and the distinction is mechanical. Repairs replace a section; repiping replaces a material — and it is the material, not the section, that is failing when leaks multiply in an older Charleston home. Galvanized lines from the metro's pre-1980 stock (68.1% of all homes) are the usual defendant. A plumber who recommends a fourth repair on that pattern without naming the alternative is not doing you a favour. Homeowners in South Charleston (13,594) and St. Albans (10,637) read this page for the same reason — the stock there is the same stock. It holds in the 21,109 homes built between 1980 and 1999 just as it holds in the older core. The pattern is not evenly spread: it concentrates in the 71,164 pre-1980 homes, thickest in the founding districts and the first suburbs — the streets around South Charleston and the old core — and thins toward Cross Lanes and the growth edge, where the stock is a generation younger. Streets matter to the timing: the founding districts near Charleston reach the pattern first, the post-war ring through South Charleston and St. Albans a decade behind, the subdivisions past Cross Lanes a generation behind that. Streets carry the same ledger at household scale: from Charleston (47,918 residents) through South Charleston (13,594) to St. Albans (10,637), the leak sequence means the same thing wherever the material matches. Where the conversations happen: the community ledger reads Charleston (47,918 residents), South Charleston (13,594), St. Albans (10,637), Cross Lanes (10,172) and Dunbar (7,340), out of 207,456 residents metro-wide, earliest and oftenest in the founding names on that list.
Is PlumbReach USA the company that will do the work at my Charleston, WV home?
Nobody from PlumbReach USA will knock on your door, because that is not the service. We connect Charleston homeowners with independent local plumbing professionals; the person who arrives is one of those professionals, working for their own business. What we publish — pages like this one, built from the metro's real housing and climate figures — is the homework we do so the connection is an informed one. The local figures behind it: 71,164 homes from before 1980 and 12,226 built since 2000, sharing one system of streets and soil. The arrangement is the same across the whole footprint: 84 ZIP codes, 3 counties, communities from Charleston through Cross Lanes — in each of them the professional is local, independent, and working their own patch of the metro's housing. It is worth being precise about the local end of the arrangement: the professional serving South Charleston or Cross Lanes sets their own terms with you, carries their own responsibility for the work, and answers for it — our routing is the only part this page undertakes. Callers from South Charleston (13,594 residents), St. Albans (10,637) and Cross Lanes get the same plain arrangement: our routing, their plumber, their terms — stated here because the metro's 207,456 residents deserve it stated. The arrangement holds in every community: the community ledger reads Charleston (47,918 residents), South Charleston (13,594), St. Albans (10,637), Cross Lanes (10,172) and Dunbar (7,340), out of 207,456 residents metro-wide.
What plumbing checks are worth doing each year in Charleston, WV?
The highest-value checks here are the ones aimed at this page's top patterns. Know and test your shutoff. Keep the meter honest — a reading taken when the house is asleep should not move. Give the water heater its yearly drain-down, and the ground-floor drains a run of water so their traps stay wet and sealed. In a metro where the median home was built in 1968, those four habits intercept most of what eventually becomes an emergency call. None of it is abstract at this scale: 87,660 households across Boone, Clay, Kanawha share one climate and one ageing stock, so a yearly rhythm kept by even a fraction of them is the difference between this metro's plumbing failing in private, one house at a time, and failing on a schedule somebody saw coming. The checks travel well because the conditions do: CHARLESTON YEAGER AP, WV US's record covers South Charleston, St. Albans and Cross Lanes alike, and the housing eras repeat across all 84 ZIP codes. A neighbour in another district keeping the same calendar is not copying you; they are reading the same data. The calendar's local proof is in the stock figures: 71,164 pre-1980 homes to keep valves alive in, 12,226 post-2000 homes reaching first-fixture age together, and 46.24 inches of rain a year testing every cleanout in Boone, Clay, Kanawha. The checks are sized to the stock's actual eras — a median build year of 1968, 41.1% of it pre-1960 — not to a generic house that exists nowhere in Charleston. The routine's territory, in codes: the codes run 25003, 25102, 25181, 25529 and 25206 among the 84 on the list, spread over Boone, Clay, Kanawha.
Why does this page lead with the problems it leads with in Charleston, WV?
Arithmetic, published. Take the metro's exposure to each known failure pattern — how many Charleston homes have the material, the age and the layout for it — and multiply by how hard the local climate works that weakness, season after season at CHARLESTON YEAGER AP, WV US. Sort descending. That sort is the list above: no editor's hunch, no borrowed ranking from a larger city, just this metro's Census profile and weather record multiplied together. Run the same scoring on any single district and the order bends: South Charleston's streets would rank their own list, Cross Lanes's another. This page ranks the metro as a whole — 87,660 households across Boone, Clay, Kanawha — which is why the evidence paragraphs keep returning to where each pattern actually concentrates. A useful check on the method: run it on South Charleston alone and the order bends toward that district's eras; run it on the whole metro — 87,660 households — and you get the list printed here. The evidence trail is on this page: the problem sections scored pattern by pattern, the housing profile drawn from Boone, Clay, Kanawha, the climate read from CHARLESTON YEAGER AP, WV US — the ranking is the two records read together, nothing else. The scoring's raw material, code by code: the codes run 25003, 25102, 25181, 25529 and 25206 among the 84 on the list, spread over Boone, Clay, Kanawha. The dataset's own label for the unit being scored: the Charleston metro — 207,456 residents, 71.3% of them owner-occupiers — scored whole, because its housing and its weather arrive whole. The sort ran over the whole list — from 25003 and 25102 through 25181, 25529 and 25206 to 25015 — and returned one order for all of it, because the inputs were the metro's totals, not any single district's.
Where are Charleston, WV's oldest homes, and why does it matter for plumbing?
Follow the building dates. Charleston's pre-1960 stock — 42,950 homes, 41.1% of the metro — concentrates in the old core and the inner suburbs, and its plumbing is the metro's oldest by the same margin. The growth rings repeat the pattern at intervals: each era's building district carries that era's pipe materials, so a plumber can often guess a home's system from its street before the door opens. It is also a numbers story: of Charleston's 104,500 housing units, the pre-1960 share is 41.1% — the largest single concentration of original-era pipework in the metro, sitting in the districts where Boone County's streets were laid out first. The drive that proves it runs from the centre of Charleston outward: through South Charleston (13,594 residents), then St. Albans (10,637), then the younger rings toward Cross Lanes — a single trip across Boone, Clay, Kanawha that travels forward through the metro's plumbing history decade by decade. It is why two homes a mile apart in Charleston can need different conversations: one on the 1960s materials near the centre, one on modern lines past St. Albans — the map of eras is the first diagnostic. ZIP by ZIP the same gradient: the oldest systems cluster in the codes nearest the centre — the 25003 side of the list — and the youngest toward 25529 at the edge, across Boone, Clay, Kanawha. The map's communities in growth order: the community ledger reads Charleston (47,918 residents), South Charleston (13,594), St. Albans (10,637), Cross Lanes (10,172) and Dunbar (7,340), out of 207,456 residents metro-wide. Counted under its Census name — the Charleston metro, 207,456 residents, 71.3% owner-occupied — the oldest layer is a defined population of homes, not a figure of speech.
If a plumber assessed my Charleston, WV home tomorrow, what would they look at first?
Read the findings other local homeowners get and a pattern assembles: valves stiff from disuse, anode rods spent in heaters older than their protection, supply lines in the material the the 1960s installed, traps dry in little-used bathrooms. A check in Charleston is essentially a census of those four, taken one house at a time — which is why the walk is standardised: the stock keeps returning the same answers, and the value lies in hearing them early. The metro's figures say why the order matters here: 71,164 pre-1980 homes means shutoffs and heaters of a certain age are the statistical norm rather than the exception, and a climate of 4,353 heating degree days works every heater in Boone County hard enough to justify its place near the front of the walk. The accents shift by ring: in the founding streets of Charleston the flags are original materials; through St. Albans (10,637 residents) they are valves and heater age; out toward Cross Lanes they are first-generation fixtures and lines under slabs — the walk is one, the findings follow the building map of Boone, Clay, Kanawha. Keep the findings with the house records: in a metro of 87,660 households, the homes whose owners can date their last check are the ones whose failures arrive as appointments — the entire point of the half hour. District accents, with figures: South Charleston (13,594 residents) leans to valves and materials, St. Albans (10,637) to heaters and drains, Cross Lanes to first-generation fixtures — one walk, three readings. The walk's districts, named: the community ledger reads Charleston (47,918 residents), South Charleston (13,594), St. Albans (10,637), Cross Lanes (10,172) and Dunbar (7,340), out of 207,456 residents metro-wide.


 PROBLEM
 SOLUTION