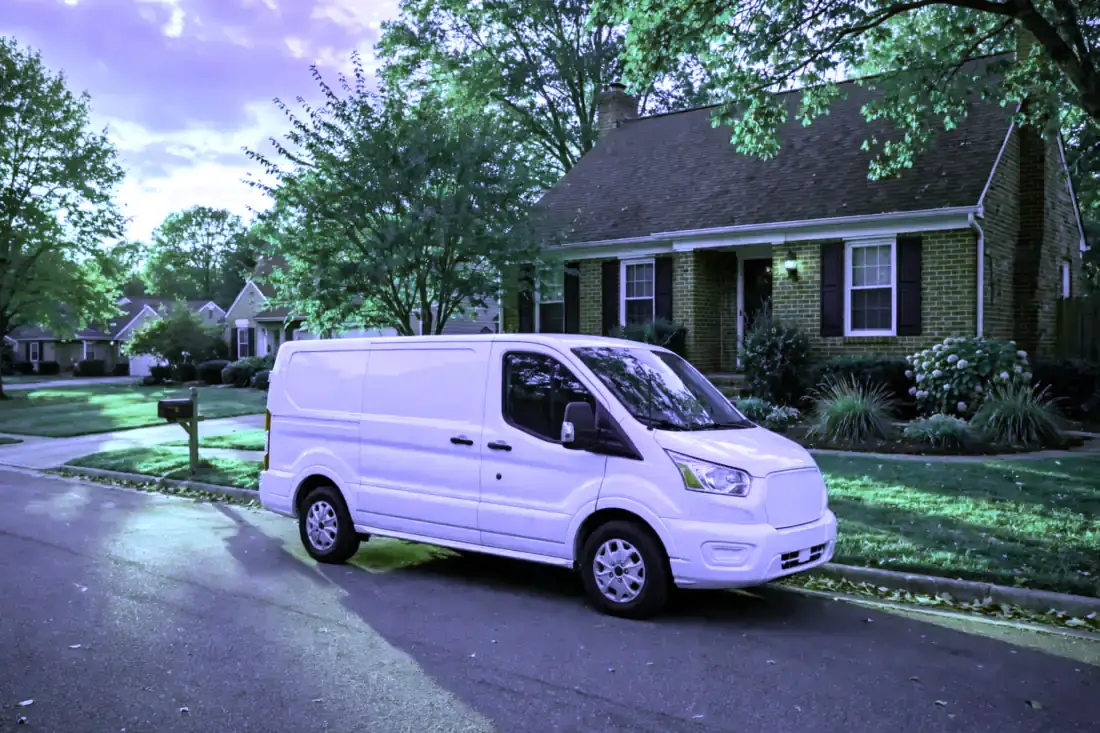


A metro's plumbing is a portrait of its building history under its weather, and Austin's portrait is painted below from its own records: Census housing figures, NOAA climate normals, the metro's ZIP codes and communities. PlumbReach USA's role is the connection to a local professional; the portrait is here so that connection starts from understanding rather than urgency.
Call center hours: Mon-Fri 7:00 AM-10:00 PM ET | Sat 8:00 AM-10:00 PM ET | Sun 7:00 AM-9:00 PM ET
The median Austin home was built in 2000; 20.2% of the stock predates 1980, and the pattern this metro's own data ranks first is slab leaks under concrete foundations. PlumbReach USA is a referral service, not a plumbing company: one call connects you with an independent local plumber serving your ZIP code.
Austin is a metro of 2,357,497 people and 948,649 households, and its plumbing is a portrait of its building history. The median home here was built in 2000; 20.2% of homes predate 1980 and 6.1% predate 1960, while 51.0% have arrived since 2000. Every one of those eras plumbed differently — different pipe materials, different drain designs, different fixtures — and they fail differently, which is why this page is organised around the patterns the data actually produces in Austin rather than plumbing in the abstract.
The pre-1980 districts are not a museum; they are most of the metro's working housing, and their plumbing is a patchwork in the literal sense — original runs beside renewed sections, a heater of one decade feeding fixtures of another. Across 202,262 such homes in Bastrop, Caldwell, Hays, Travis, Williamson, no two systems share exactly the same repair history, which is why the guidance below insists on pattern over incident: in patchwork plumbing, what has already been replaced is as diagnostic as what has failed.
The newer homes also house much of the metro's renting population, and rented plumbing lives a harder life: more occupants per system in many cases, faults reported later, and maintenance decided by someone who does not live with the drip. Across Austin, 948,649 households depend on systems most of them did not choose, and the post-2000 stock — 510,660 homes — is where the tenancy share runs highest. The failures are the modern ones: cartridges, heater elements, slab-line questions. They arrive on the subdivisions' shared schedule regardless of who holds the lease.
The weather's part in this is written at AUSTIN BERGSTROM AP, TX US, where an average year carries 35.57 inches of precipitation, 123.5 days at ninety degrees or more and 33.0 nights at freezing or below. Pipes experience that year as workload and as hazard in roughly equal measure — the workload in the heater's cycle count and the drains' burden, the hazard in the exposed runs and the swelling soil. The problem ranking further down is simply the housing profile above, read under this sky.
The metro's building eras on one side, its weather record on the other — and its plumbing where the two meet.
Break the stock down by building era and the profile sharpens. Before 1960: 6.1% of homes, roughly 61,079 of them. From 1960 to 1979: 14.1%, about 141,183. From 1980 to 1999: 28.8%, about 288,373. Since 2000: 51.0%, about 510,660. Four eras, four material palettes — and the balance among them is this metro's plumbing character in a single paragraph.
New-stock metros have their own signature, and Austin has it in full: most homes built since 2000, most systems young, most plumbing work a matter of waves — the heater wave, the cartridge wave, the first slab questions — arriving street by street as identical subdivisions age in lockstep. The older pockets still produce the deepest single jobs, but the metro's plumbing centre of mass sits in its newest postcodes, and every year the waves get closer together.
The runner-up era is 1980-1999, with 28.8% of homes. That stock has left its carefree decades and entered its maintenance decades, and it shows in the call pattern around Round Rock and the other districts of those years: heaters on their second or third cycle, fixtures reaching their wear points together, drains still young enough to reward attention over replacement.
Austin's weather, reduced to what a pipe experiences: 123.5 hot days a year loading the drains and heaters, 33.0 freezing nights testing every exposed run, and 35.57 inches of rain moving through the soil that holds the laterals. NOAA's normals at AUSTIN BERGSTROM AP, TX US — 1,718 heating degree days, 2,996 cooling degree days — are the long average of that experience, and they are why this metro's problem list is not interchangeable with a milder or harsher metro's.
A profile is only useful if it predicts something, and this one predicts the shape of a plumbing diary in Austin: which streets will call about drains, which about pressure, which about heaters, and in which months. Everything after this section is that prediction written out as services, problems and answers — the numbers first, the narrative second, the way the evidence actually runs.
Ranked for this metro alone, from its Census housing profile and NOAA climate record.
The slab leak's cruellest feature is its patience. A pinhole in a pressurised line under concrete does not rest: it runs at night, on holidays, while the house stands empty, moving water into soil that carries it away unseen. Weeks of that patience show up in the aggregates — a bill trending up across three statements, a meter reading that will not reconcile with the household's habits. In Austin's slab-built districts the pattern repeats in house after house of the same subdivisions, because the lines were poured in the same seasons and age in convoy. Detection ends the patience at a marked point on the floor.
Once a slab leak is located, the repair decision turns on geometry. Opening the floor at the marked point reaches the failed section directly and restores the original run — a good answer when the line is otherwise sound and the spot sits under replaceable flooring. Rerouting abandons the buried run entirely and carries the water through walls and ceiling instead — a better answer when the line has form, when several runs share the slab, or when the floor above is worth more than the pipe below. Plumbers in Austin argue both sides of that choice daily; the honest version depends on the leak's position, the line's history, and what the floor is made of.
One more way to size it: this metro holds 1,001,295 housing units, and slab construction accounts for a large share of everything built from the post-war decades onward — the tracts first, then the 510,660 homes since 2000. A leak class that hides inside that much concrete, in soil that moves with the seasons, does not need unusual bad luck to lead a ranking; it needs only ordinary time.
Strain is what a decade of mornings does to a tank. Each cycle heats, expands, cools and settles; sediment from every gallon the household has ever drawn settles a fraction at a time into the bottom, where it insulates the burner, lengthens the cycles and bakes the steel. In Austin, where demand runs high through the long hot season, that accumulation is the difference between a heater that fades quietly at year twelve and one that lets go at year seven. The appliance looks identical from the closet door. Its account of itself, told in rumblings and recovery times, is not.
Recovery time is the number that runs a household's mornings, and it is the first thing sediment steals. A tank rated to serve a family when new delivers less hot water per heating cycle every year as the sediment layer thickens and the burner's work goes into heating rock instead of water. In Austin, where summer demand piles showers, laundry and dishwashing into the same hours, that slow decline shows up as a household quietly rationing hot water without ever deciding to. Flushing the tank returns some of it; a spent anode and a rumbling, scaled tank are the signs the decline has become structural, and the conversation turns to replacement.
Do the local sums: 948,649 households heating water through 2,996 cooling degree days and 1,718 heating degree days a year means the metro's heater fleet cycles relentlessly, and sediment settles further with every cycle. Heaters in Austin rarely die young — they die on schedule, and the schedule is written by how hard the climate makes them work and whether anyone ever drained the sediment out of the tank.
When water freezes inside a pipe it expands, and the pressure it creates has nowhere to go: the pipe splits, often at a joint or an elbow, and the damage is done before anything thaws. Austin winters make this a standing risk rather than a freak event — the long-term climate record at AUSTIN BERGSTROM AP, TX US shows about 33.0 nights a year at or below freezing and a heating load of 1,718 degree days, which is why pipes in unheated garages, crawl spaces and exterior walls here live dangerously every cold snap. The split itself usually announces at the thaw, when water returns to the line and finds the opening. Homes in Bastrop, Caldwell, Hays, Travis, Williamson that have frozen once tend to freeze in the same place again, because the exposure that caused it — a vent blowing cold air on a line, insulation that stops short of a corner — is still there. A plumber who repairs a burst pipe here will trace why that run froze and what changes: insulation, rerouting a short section, or sealing the air leak that bathes the pipe in cold air through the coldest nights.
The burst itself usually happens quietly, inside a wall or under a floor, during the coldest hours — but the flood waits for the thaw. Ice seals the split it made, and only when temperatures rise and the ice lets go does the water start moving into the house. That delay is why freeze damage so often greets a Austin household in the morning or on return from a trip away. It is also why the checks after a hard freeze matter: pressure oddly low, a meter turning with nothing running, a damp patch at a wall base. Catch the split at the weep stage and the repair is a pipe; catch it after the thaw and it is a room.
Austin's freeze maths is unforgiving: 33.0 sub-freezing nights in an average year at AUSTIN BERGSTROM AP, TX US, multiplied by every uninsulated run in every older home, gives the season hundreds of chances to find one weak line. The splits favour the same addresses winter after winter — the the 2000s stock with pipes in the cold zones of the house.
Run two taps at once in a galvanized house and the second one apologises. That is the material's signature in old age: rust accreting inside the bore until the pipe delivers a fraction of its designed flow, weakest at the far end of the run. Austin carries 202,262 pre-1980 homes, and the ones still on original galvanized announce themselves the same way — pressure that fades year by year, water that runs tea-coloured after a quiet weekend. Repiping is simply the moment the household stops negotiating with the symptom and replaces the cause.
Galvanized pipe fails politely, which is exactly the problem — it gives a household years of small warnings that are easy to live with. The zinc coating that once protected the steel wears through, rust takes its place, and the rust grows inward like a narrowing artery. Flow to the farthest fixtures drops first. A shower that shares a line with a running tap loses its pressure. By the time the water itself runs discoloured after the house has sat quiet overnight, the narrowing is well advanced. None of this is a single emergency; it is a system reaching the end of its design life on schedule, and in Austin's pre-1980 neighbourhoods that schedule is arriving for whole streets at once, because the pipes went in together.
The scale of it in Austin: about 202,262 homes predate 1980, the decades when galvanized steel was plumbed into houses as a matter of course. Those lines have been corroding inward ever since, quietly and at different speeds — two houses on the same street in Austin can be years apart in symptoms, but they are reading from the same page of the same story.
Ownership is the first surprise with a lateral: the buried stretch between the house and the street main typically belongs to the homeowner, however public it feels. The second surprise is its age. In Austin, laterals under the older streets were laid for the homes counted in the 202,262 pre-1980 properties — jointed clay or iron, bedded in soil that has swelled and shrunk through 35.57 inches of rain a year ever since. A pipe can be nobody's thought for fifty years and then become the only thought in the house, usually on the evidence of the ground-floor drain in it.
Slope is the lateral's invisible specification. A sewer line does not need much fall — a quarter inch per foot is the classic figure — but it needs it consistently, and ageing takes consistency away: a section settles, a joint steps down, and the line develops a reach where flow slows and solids settle out. That belly then collects a little more each week, narrowing the line from the bottom up. Many a Austin lateral diagnosed as 'blocked' is really 'bellyed' — clearable today, certain to collect again. The camera distinguishes the two, and the distinction decides whether the household is booking a cleaning or planning a repair.
Universality is the point: every housing unit in the metro — 1,001,295 of them — drains through one lateral apiece, and the older half of that stock is served by lines as old as the homes above them. A component that universal, ageing on that schedule, does not need bad luck to top a problem list; it needs only time.
Summer in Austin runs long and hot — the climate record shows about 123.5 days a year reaching 90 degrees — and plumbing feels it in quieter ways than winter pipes do. Water heaters work against hot garages and warm incoming water habits shift: more showers, more laundry, irrigation mistakes that cross into the house system, and slab lines expanding and contracting with the soil as it dries. The season's useful checks are a water bill read for leaks the heat hides, a look at the water heater for the first signs of base corrosion, and attention to any patch of landscaping that stays green while the rest of the yard goes dry — that spot is often water that should be inside a pipe.
Heat loads this metro's systems from two directions at once: 123.5 days a year at 90 degrees or more at AUSTIN BERGSTROM AP, TX US, driving demand, while the same heat dries the soil under the 510,660 slab-built homes built since 2000. The season's calls — heaters, slab questions, fixture wear — are that double load presenting itself.
Slab leaks map onto Austin's growth pattern with unusual precision. The leaks live where the slabs are: the post-war subdivisions, the boom-era tracts around Austin, and the 510,660 homes built since 2000 on concrete. Pier-and-beam and basement homes in the older districts have their own leak problems, but they announce them visibly — it is the slab stock that hides its failures under flooring. Within a slab neighbourhood the risk is shared: same builder era, same soil, same line materials, which is why one confirmed leak on a street reasonably raises the alertness of every house on it.
Strip the pattern down to its inputs and the ranking stops being mysterious: 948,649 households drawing on systems installed across a median build year of 2000, in a climate that swings between 123.5 days of serious heat and 33.0 freezing nights. Whatever pattern a metro with those inputs manufactures most, it manufactures here — the lead position is less a title than a consequence, recalculated from the same public records any sceptic can check.
Experienced local practice starts with the simple certainties — the observations that take minutes and decide the most:
Ordered by what this metro's data says its homes need most.
Leaks divide into the ones that announce themselves and the ones that invoice quietly. The second kind — a line weeping inside a wall, a slab run losing water into soil, a joint misting under a floor — can run for months on evidence no louder than a climbing bill. Detection exists for that quiet kind: meters, acoustics and pressure tests narrowing a whole house's worth of pipework to a single marked point.
Detection work in Austin has a geography. The slab subdivisions produce the under-floor leaks, listened for through concrete. The older districts — Austin's early streets and the pre-war pockets — produce the wall and ceiling leaks, mapped by moisture and pressure. The yard lines produce the third kind, found where the meter says water is leaving and the grass says where. Same instruments, three different hunts, and the metro's layout of eras decides which hunt a given address gets. It is a service that exists because Austin was built in layers, each layer hiding its water differently. From Round Rock to Georgetown, the pattern repeats wherever the housing era matches.
Scale the problem by the Census count and it stays concrete: 1,001,295 housing units, each a small network of pressurised lines, each capable of losing water silently. The meters across Austin register those losses in aggregate; the detection visit exists to assign one of them to one address — in Round Rock this month, somewhere else next.
In Austin this service is booked most often through the problem patterns at the top of this page — the metro's housing data, not habit, sets the order. If your home is in the 20.2% built before 1980, mention its age on the call: it changes the parts the plumber loads before heading to Austin and the rest of the metro.
A heater rarely dies all at once; it dims. Recovery slows, temperatures wander, the tank starts talking. Repair makes sense while the vessel is sound; once the steel itself is going, replacement is the honest answer, matched in capacity and fuel to how the household actually uses hot water.
Hot water shapes a household's day so completely that the heater is most truly understood as a member of it — one that works silently for years and resigns without notice. In Austin those resignations bunch predictably: after the first cold snap drives inlet temperatures down, through the peak-demand weeks of high summer, in the subdivisions where every tank was installed in the same season of the same year. The servicing visit interrupts the resignation letter — sediment drained, anode judged, connections checked — and the replacement conversation, when it comes, starts from evidence gathered in the closet rather than steam in the shower. That is the daily reality for the 948,649 households spread across Bastrop, Caldwell, Hays, Travis, Williamson.
The arithmetic behind the diary: 948,649 households heating water through 2,996 cooling degree days and 1,718 heating degree days a year — every one of those households a tank ageing on the same climate's schedule, from the pre-war homes to the newest builds around Cedar Park.
Where this service gets booked in Austin follows the map on this page: the older districts generate the deep-end work, the post-2000 subdivisions the wear-and-tear work, and the 288,373 homes in between split the difference. Telling the call center your home's build decade — most Austin owners know it within a few years — puts the right kit on the van the first time.
Pipes fail in two tenses: suddenly, at a joint or a split, and gradually, as a material narrows, thins or pits across a whole system. The first tense asks for a repair; the second eventually asks the larger question. Pipe services cover both — the sectional fix that restores a sound system, and the planned renewal that replaces a failing material through the whole house, routed to spare the building and staged to keep the household in water.
The repiping conversation in Austin starts with its housing data: median build year 2000, 20.2% of homes from before 1980, and whole districts plumbed in materials that are now at or past their expected service lives. Galvanized lines in the older neighbourhoods have been narrowing from the inside for decades; the symptom homeowners notice — pressure fading year by year — is the pipe's inner diameter closing. One pinhole in that stock is an event; the third is a pattern, and the plumbers who work Austin and the older core will say so plainly rather than sell a fourth repair. Count it in homes if you prefer: 202,262 built before 1980, 510,660 since 2000, one shared system of soil and seasons.
Pipe work divides by era in this metro with unusual neatness: renewal conversations in the 202,262 pre-1980 homes, sectional repairs in the middle ring, and near-silence from the 510,660 post-2000 homes whose lines are still young. A call from Leander can sit in any of the three bands; the home's build year says which before the door opens.
One local habit worth copying: Austin homeowners who mention their street's building era when they book get a better-matched visit, because a plumber heading to a the 2000s home in Bastrop County loads different parts than one heading to a slab-built subdivision in Round Rock. The service is the same; the preparation is local.
The sewer line is the one pipe every other pipe depends on. When it bellies, cracks or fills with roots, the whole house feels it through its ground-floor fixtures. Repair ranges from sectional fixes through a cleanout to full replacement, chosen from camera footage rather than guesswork.
Consider the lateral as the home's only road out: every drain, every flush, every appliance discharge travels it. In Austin's older districts that road was built generations ago, in sections, and it has been subsiding, rooting and corroding on its own schedule ever since. The sewer visit surveys the road before recommending anything — its material, its slope, where it is broken versus merely blocked — because the remedies differ by an order of magnitude and the footage, not the symptom, is what separates them. A cleared symptom on a broken road is a postponement, and local plumbers here give their advice accordingly: honestly, from the camera's evidence. Ask in Cedar Park and the answer rhymes with Austin: same eras, same materials, same calendar of failures.
Sewer demand follows the founding map: the districts built first, around the old centre and out through Kyle, hold the jointed clay and iron; the growth rings hold plastic with decades in hand. 6.1% of the metro's homes stand on the founding side of that line, which is why the footage here so often shows a pipe at the end of its story.
Where this service gets booked in Austin follows the map on this page: the older districts generate the deep-end work, the post-2000 subdivisions the wear-and-tear work, and the 288,373 homes in between split the difference. Telling the call center your home's build decade — most Austin owners know it within a few years — puts the right kit on the van the first time.
One call from anywhere in the Austin metro — from Austin out to Cedar Park — routes to the local professional on cover; the failure patterns they expect first are the ones this page's data ranks.
Across Bastrop, Caldwell, Hays, Travis, Williamson, drain calls follow the building map: iron and clay near the old core around Austin, plastic at the growth edge — one service, two different crafts, both covered by the routing on this page.
Toilet calls in Austin are the small end of the diary and the most democratic: every era of the 1,001,295-home stock produces them, and the local fix starts with the mechanism in the tank, not the porcelain.
Drips and disposals across Bastrop, Caldwell, Hays, Travis, Williamson are small jobs with a standard: repair the mechanism where the fixture deserves it, renew it where it does not, and check the shutoffs and supply lines while the cabinet is open.
Two patterns generate most of the bookings behind the services above: Slab leaks under concrete foundations and water heaters working hard year-round. That is why the order of this page's service list is what it is — the services answering those patterns come early, and the rest follow in the order the metro's data supports. A homeowner whose home matches the local profile — built in the metro's big decades, in one of its older districts — is, statistically, reading their own shortlist.
 PROBLEM
 SOLUTION
Population 967,862
Population 124,288
Population 78,803
Population 77,474
Population 68,920
Population 67,880
Population 65,162
Population 52,439
Population 32,188
Population 20,953
Population 19,130
Population 18,683
Also in the Austin metro: Manor (population 16,917), Taylor (population 16,767).
The communities in the grid are not suburbs of the page; they are its subject as much as Austin is. Round Rock (124,288 residents) and Georgetown (78,803) carry their own building decades, their own pipe materials and their own positions in the problem ranking's logic — a lateral under a Round Rock street answers to the same data as one in the centre, but to a different era of it. Coverage here is defined by the ZIP list below; understanding is defined street by street, and this page's figures are the metro-wide version of a story each community tells in its own numbers.
Also on the Austin map: Cedar Park (77,474), San Marcos (68,920), Leander (67,880), Pflugerville (65,162), Kyle (52,439) — communities spread across Bastrop, Caldwell, Hays, Travis, Williamson, each with housing from its own growth years. A plumber routed through PlumbReach USA to any of them is working from this same page: the metro data does not change at the city limit, but the housing on your street — its age, its materials, its soil — is what the visit is really about.
The metro's weight is not evenly spread. Austin holds 967,862 of the 2,357,497 residents; Round Rock and Georgetown add 124,288 and 78,803; and the remainder scatters across the smaller places above, some no bigger than a few thousand people. Plumbing follows the weight — most calls come from where most homes are — but era matters more than size: a small community of 1960s housing generates older-system work than a large new subdivision does.
Administratively the metro is drawn from Bastrop, Caldwell, Hays, Travis, Williamson — 5 in all — with Bastrop County at its centre. County lines do not change pipe physics, but they do shape the paperwork around the work: permits, inspections and code details are county and city business, which is one reason the professional who serves your street is a local one.
This page ends at the metro boundary, but the region does not: San Antonio, TX, Killeen–Temple, TX and College Station, TX continue the coverage in their own directions, each with a profile built from its own Census and NOAA figures. If your home sits near the line between metros, go by your ZIP code — it places you in the dataset that describes your housing.
The region around Austin is a set of variations on its theme: San Antonio, TX, 72 miles off, runs a median build year of 1992 on a metro population of 2,813,140; Killeen–Temple, TX (72 miles) medians 1993 on 511,497; College Station, TX (79 miles) medians 1994 on 287,476. Nearness is not sameness — a few decades of median build year separate their plumbing as surely as the miles separate their maps.
Divide the stock by the map and the densities appear: roughly 11,251 housing units for every covered ZIP code, 189,730 households to a county, 14 named communities in the grid. The balance between the generations reads 0.4 pre-1980 homes for every home built since 2000 — a single ratio that quietly predicts whether a metro's plumbing week leans toward renewal work in the old districts or first-generation upkeep in the new ones.
Austin by the derived numbers — median home age 26 years · owners in 558,754 homes, renters in 389,895 · each covered ZIP code carrying about 686 pre-1960 homes · a heating-to-cooling degree-day ratio of 0.57 · 903 mm average annual rainfall.
Before an emergency, read the guide: How to shut off your home's water main
Describe the problem and the call center routes you to an independent local plumber who works in the Austin metro.
Call center hours: Mon-Fri 7:00 AM-10:00 PM ET | Sat 8:00 AM-10:00 PM ET | Sun 7:00 AM-9:00 PM ET