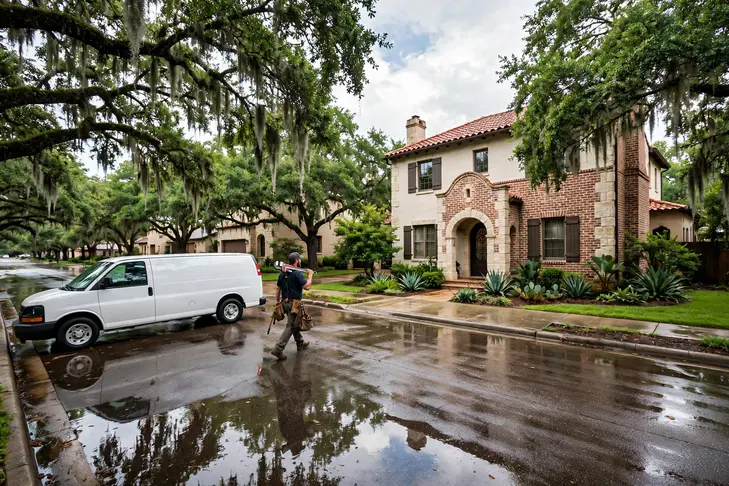


PlumbReach USA connects San Antonio homeowners with independent local plumbers. This page is built from the metro's own Census housing data, ZIP codes and climate record — the plumbing problems described here are the ones San Antonio homes actually have.
Call center hours: Mon-Fri 7:00 AM-10:00 PM ET | Sat 8:00 AM-10:00 PM ET | Sun 7:00 AM-9:00 PM ET
The median San Antonio home was built in 1992; 33.9% of the stock predates 1980, and the pattern this metro's own data ranks first is slab leaks under concrete foundations. PlumbReach USA is a referral service, not a plumbing company: one call connects you with an independent local plumber serving your ZIP code.
Two numbers frame everything that follows: 63.5% of San Antonio homes are owner-occupied, and the median one was built in 1992. Ownership matters to plumbing because owners inherit their systems whole — every material decision a builder made in the 1990s or earlier is still in the walls, ageing on its original schedule. With 33.9% of homes predating 1980 and 39.8% arriving since 2000, the metro is really two housing stocks sharing one map, and they are taken separately below before the problems are ranked.
The pre-1980 districts are not a museum; they are most of the metro's working housing, and their plumbing is a patchwork in the literal sense — original runs beside renewed sections, a heater of one decade feeding fixtures of another. Across 351,657 such homes in Atascosa, Bandera, Bexar, Comal, Guadalupe, Kendall, Medina, Wilson, no two systems share exactly the same repair history, which is why the guidance below insists on pattern over incident: in patchwork plumbing, what has already been replaced is as diagnostic as what has failed.
There is a second way to read the growth figures: as a maintenance wave still approaching. The 412,860 homes built since 2000 were handed over with everything new at once — heaters, cartridges, supply lines, seals — and new things age in convoy. The first replacements in those subdivisions have begun; the wave behind them is arithmetic. Households in New Braunfels and the other growth districts who learn their systems now, while the systems are still young, are the ones who will meet that wave as a schedule rather than a surprise.
The climate written over all of it comes from the NOAA station at SAN ANTONIO INTL AP, TX US: an average year brings 1,438 heating degree days, 3,148 cooling degree days and 32.38 inches of precipitation. Those are not abstractions to a buried pipe or an exposed line — they set how often soil around a sewer lateral swells and shrinks, how hard a water heater cycles in January and July alike, and whether an uninsulated garage line is a worry or a certainty. The problem sections that follow are selected by exactly these numbers, combined with the housing-age profile above.
The metro's building eras on one side, its weather record on the other — and its plumbing where the two meet.
Lay the eras side by side instead: 14.4% pre-1960 (149,376 homes), 19.5% from 1960-1979 (202,281), 26.3% from 1980-1999 (272,819), and 39.8% since 2000 (412,860). No single era tells the story — the proportions among them do, and those proportions are different in every metro this site covers.
New-stock metros have their own signature, and San Antonio has it in full: most homes built since 2000, most systems young, most plumbing work a matter of waves — the heater wave, the cartridge wave, the first slab questions — arriving street by street as identical subdivisions age in lockstep. The older pockets still produce the deepest single jobs, but the metro's plumbing centre of mass sits in its newest postcodes, and every year the waves get closer together.
The runner-up era is 1980-1999, with 26.3% of homes. That stock has left its carefree decades and entered its maintenance decades, and it shows in the call pattern around New Braunfels and the other districts of those years: heaters on their second or third cycle, fixtures reaching their wear points together, drains still young enough to reward attention over replacement.
Translate the climate record into plumbing terms and it comes out as three working conditions. Condition one, the freeze count — 14.0 nights a year when exposed water can solidify and split its container. Condition two, the heat count — 122.4 days that load drains, heaters and tempers simultaneously. Condition three, the water itself: 32.38 inches of it arriving from the sky to move the soil around every lateral in the metro. San Antonio's systems are engineered, installed and aged inside those three conditions, and their failures carry the conditions' fingerprints.
A profile is only useful if it predicts something, and this one predicts the shape of a plumbing diary in San Antonio: which streets will call about drains, which about pressure, which about heaters, and in which months. Everything after this section is that prediction written out as services, problems and answers — the numbers first, the narrative second, the way the evidence actually runs.
Ordered by what this metro's data says its homes need most.
Pinpoint first, open second. That order defines leak work: isolate sections, listen along the runs, confirm with pressure, and only then cut — precisely, once. The repair itself is usually ordinary plumbing; the skill being bought is knowing exactly where ordinary plumbing needs to happen.
The leaks that hit San Antonio homeowners hardest share a trait: they were small for a long time. A supply line misting inside a wall cavity through a whole season, a slab run weeping into dry soil that drinks it silently — by the time evidence surfaces, the water has been travelling for months. Detection work exists to shorten that interval, and in this metro it leans on the meter above all: the one instrument that never sleeps, registering the leak's signature in the small hours when an honest system reads zero. A household that knows its meter's quiet behaviour owns an early-warning system already installed. The 32.38 inches of rain in an average year here is part of the story too — buried lines feel every wet season.
The search territory is the metro's whole stock: 412,860 homes built since 2000, most of them hiding lines under slabs, against 351,657 pre-1980 homes hiding theirs in walls and crawl spaces — detection in New Braunfels and detection in the subdivisions are different hunts for the same missing water.
One local habit worth copying: San Antonio homeowners who mention their street's building era when they book get a better-matched visit, because a plumber heading to a the 1990s home in Atascosa County loads different parts than one heading to a slab-built subdivision in New Braunfels. The service is the same; the preparation is local.
Pipes age by material: galvanized chokes with rust, copper pits into pinholes, early plastic turns brittle. Repair answers the isolated failure; repiping replaces a system whose failures have become a rhythm, rerunning supply lines in modern material while the house stays liveable around the work.
A repipe decision in San Antonio is usually made at a kitchen table, from three exhibits: the water's behaviour at the taps, the count of repairs already paid for, and the material visible wherever the system shows itself. Exhibits like those persuade because they are the household's own. The work itself, when it comes, is less disruptive than its reputation — modern lines route through attics, closets and chases, water stays on for most of the project, and the plaster sacrificed is measured in patches, not rooms. What the household buys back is the thing the old material had been taxing away: pressure, clarity, and the right to forget the pipes exist. From New Braunfels to Schertz, the pattern repeats wherever the housing era matches.
The repair-or-renew caseload is set by one figure above the rest: 33.9% of San Antonio homes predate 1980, plumbed in the materials now at the end of their service lives. Around Timberwood Park (34,980 residents) as in the old core, that percentage is not an abstraction — it is the street's plumbing, house by house.
Where this service gets booked in San Antonio follows the map on this page: the older districts generate the deep-end work, the post-2000 subdivisions the wear-and-tear work, and the 272,819 homes in between split the difference. Telling the call center your home's build decade — most San Antonio owners know it within a few years — puts the right kit on the van the first time.
Of all a home's pipes, the sewer lateral works under the worst conditions: buried, jointed, rooted at, and loaded by every fixture in the building. Its care begins with seeing it — a camera run that records material, slope and damage — and proceeds by the footage's logic: clear what clearing cures, mend what is locally broken, renew what has failed along its length. No stage of that is guesswork, and the homeowner sees the same footage the plumber does.
Every home in San Antonio drains to one line, and that line's condition is written in the metro's housing data: a median build year of 1992 means half the metro's laterals have been buried for decades, ageing in step with the houses above them. In the newer areas — 39.8% of homes built since 2000 — the pipe is plastic and the problems are different: bellies where bedding settled, construction debris, a joint shifted by soil movement. The camera inspection is the same either way, and it is what sizes the job: spot repair, partial replacement, or the full run, each with footage to justify it. Ask in Timberwood Park and the answer rhymes with San Antonio: same eras, same materials, same calendar of failures.
Sewer demand follows the founding map: the districts built first, around the old centre and out through Canyon Lake, hold the jointed clay and iron; the growth rings hold plastic with decades in hand. 14.4% of the metro's homes stand on the founding side of that line, which is why the footage here so often shows a pipe at the end of its story.
In San Antonio this service is booked most often through the problem patterns at the top of this page — the metro's housing data, not habit, sets the order. If your home is in the 33.9% built before 1980, mention its age on the call: it changes the parts the plumber loads before heading to San Antonio and the rest of the metro.
Everything hot in a house — showers, laundry, dishes — passes through one tank, which is why its failures empty the whole routine at once. Servicing covers the wearing parts and the safety valve; installation work sets its successor up level, vented, drained and strapped, ready for its own decade of mornings.
The heater fleet in San Antonio was not installed one household at a time; it arrived with the subdivisions, street after street of identical tanks set in the same season. That is why replacement calls arrive in neighbourhood waves, and why an experienced local plumber can guess a tank's age from the street it stands on. The servicing side respects the same pattern: sediment from 3,148 cooling degree days of hard cycling, anodes spent on the metro's water, thermostats drifting — each fixable alone, but together the biography of a unit deciding, this year or next, whether it is a repair or a replacement. Count it in homes if you prefer: 351,657 built before 1980, 412,860 since 2000, one shared system of soil and seasons.
The arithmetic behind the diary: 949,097 households heating water through 3,148 cooling degree days and 1,438 heating degree days a year — every one of those households a tank ageing on the same climate's schedule, from the pre-war homes to the newest builds around Converse.
Where this service gets booked in San Antonio follows the map on this page: the older districts generate the deep-end work, the post-2000 subdivisions the wear-and-tear work, and the 272,819 homes in between split the difference. Telling the call center your home's build decade — most San Antonio owners know it within a few years — puts the right kit on the van the first time.
One call from anywhere in the San Antonio metro — from San Antonio out to Timberwood Park — routes to the local professional on cover; the failure patterns they expect first are the ones this page's data ranks.
Across Atascosa, Bandera, Bexar, Comal, Guadalupe, Kendall, Medina, Wilson, drain calls follow the building map: iron and clay near the old core around San Antonio, plastic at the growth edge — one service, two different crafts, both covered by the routing on this page.
Toilet calls in San Antonio are the small end of the diary and the most democratic: every era of the 1,037,336-home stock produces them, and the local fix starts with the mechanism in the tank, not the porcelain.
Drips and disposals across Atascosa, Bandera, Bexar, Comal, Guadalupe, Kendall, Medina, Wilson are small jobs with a standard: repair the mechanism where the fixture deserves it, renew it where it does not, and check the shutoffs and supply lines while the cabinet is open.
If this page's services were ranked by San Antonio's call patterns rather than listed in catalogue order, they would come out much as they do here — because the ranking behind them is data, not habit. Slab leaks under concrete foundations leads the metro's problem table and galvanized pipes at the end of their life follows, so the services answering them lead the list. The long tail of a metro's plumbing life — fixture failures, toilet calls, the single unexplained leak — fills in the diary around them, here as everywhere.
Ranked for this metro alone, from its Census housing profile and NOAA climate record.
Consider what a slab foundation asks of a water line: to be buried at the pour, unserviceable by design, and to outlast the building it serves. Most lines manage it. The ones that do not — chafed at a bend, worked by the soil's seasonal movement, thinned by decades of hot water — fail into the one medium that hides them completely. San Antonio's growth districts around San Antonio hold this arrangement by the thousand. The leak hunt therefore runs on inference sharpened by instruments: the meter's testimony, the floor's warmth, the hiss through concrete, converging on a point small enough to open.
The cruel arithmetic of a slab leak is that time is water. A pinhole under concrete does not drip into a bucket; it saturates the ground, swells what can swell, and bills the household for every gallon. Weeks of it can pass between the first warm patch on the floor and the diagnosis, which is why the meter test matters so much in San Antonio's slab districts: ten minutes with every tap closed tells a household whether its concrete is hiding something, long before the floor itself confesses.
The local denominator matters: 412,860 of the metro's homes went up since 2000, most on slabs, most with lines beneath them. Even a small failure rate across that many buried runs produces a steady stream of leaks — and the stream is young, because those lines are only now reaching the age where soil movement and hot-water cycling start their work.
Galvanized steel announces its age through the water itself. The zinc coating that once protected the pipe is long spent; the steel beneath rusts inward, and the bore narrows to a passage that delivers less water every year. Households adapt without noticing — the shower accepted as weak, the washing machine's fill taken as slow — until a fixture upgrade or a guest's comparison names the decline. In San Antonio's pre-1980 districts that decline is the stock's shared condition, written into 351,657 homes, and the repipe conversation begins when the household stops adapting and starts measuring.
Galvanized pipe fails politely, which is exactly the problem — it gives a household years of small warnings that are easy to live with. The zinc coating that once protected the steel wears through, rust takes its place, and the rust grows inward like a narrowing artery. Flow to the farthest fixtures drops first. A shower that shares a line with a running tap loses its pressure. By the time the water itself runs discoloured after the house has sat quiet overnight, the narrowing is well advanced. None of this is a single emergency; it is a system reaching the end of its design life on schedule, and in San Antonio's pre-1980 neighbourhoods that schedule is arriving for whole streets at once, because the pipes went in together.
Count it by era rather than by street: the metro's homes built between the war years and 1980 — the heart of the galvanized period — number in the tens of thousands here, and the 351,657 pre-1980 homes overall are the pool this problem draws from. Plumbers working San Antonio and the older districts can often date a home's pipework from the kerb, because the building booms that raised those neighbourhoods plumbed them all the same way.
Ownership is the first surprise with a lateral: the buried stretch between the house and the street main typically belongs to the homeowner, however public it feels. The second surprise is its age. In San Antonio, laterals under the older streets were laid for the homes counted in the 351,657 pre-1980 properties — jointed clay or iron, bedded in soil that has swelled and shrunk through 32.38 inches of rain a year ever since. A pipe can be nobody's thought for fifty years and then become the only thought in the house, usually on the evidence of the ground-floor drain in it.
Slope is the lateral's invisible specification. A sewer line does not need much fall — a quarter inch per foot is the classic figure — but it needs it consistently, and ageing takes consistency away: a section settles, a joint steps down, and the line develops a reach where flow slows and solids settle out. That belly then collects a little more each week, narrowing the line from the bottom up. Many a San Antonio lateral diagnosed as 'blocked' is really 'bellyed' — clearable today, certain to collect again. The camera distinguishes the two, and the distinction decides whether the household is booking a cleaning or planning a repair.
Universality is the point: every housing unit in the metro — 1,037,336 of them — drains through one lateral apiece, and the older half of that stock is served by lines as old as the homes above them. A component that universal, ageing on that schedule, does not need bad luck to top a problem list; it needs only time.
Iron drains do not fail the way modern pipes fail. Plastic cracks; iron thins, roughens and narrows from within, wall by wall, until the smooth bore the installer left is a reef of corrosion products that catches everything the household sends down. In San Antonio, that reef is growing under the oldest streets in the metro — the homes around San Antonio plumbed when iron was the only serious choice. A line in this condition can serve for years in a diminished way, draining slowly, complaining occasionally, which is exactly how it escapes attention until the day it stops entirely.
The pipe itself explains the timeline. Cast iron drains by gravity, slowly, and everything a household sends down it — grease films, mineral-heavy water, the occasional corrosive cleaner — works on the iron for decades. The metal does not fail evenly: it thins first at the bottom of horizontal runs, where water and grit sit longest, and at the joints where sections meet. That is why two San Antonio homes of the same age can be in different places with the same pipe: usage, water chemistry and soil conditions around the line all vote on how fast it goes. What a camera inspection adds is certainty — the difference between a line that needs cleaning, a line that needs a section replaced, and a line living on borrowed time.
Put a number on it locally: roughly 149,376 homes in the San Antonio metro were built before 1960, when cast iron was the default drain material — and cast iron installed then has now been underground for six decades or more. Not every one of those lines has failed, and plenty test sound on a camera, but the population of pipes at risk here is counted in the tens of thousands of homes, which is why this pattern sits where it does on this page.
A water heater's workload is set by the climate around it and the water coming into it, and San Antonio asks plenty of its heaters: the climate record shows 3,148 cooling degree days and 1,438 heating degree days a year, which together mean ground water arrives cold in winter, hot showers run long, and the tank cycles hard across the whole calendar. Every cycle moves sediment: minerals settle out of heated water and collect on the tank floor, where the layer insulates the water from the heat source, makes the burner or element run longer, and produces the rumbling and popping homeowners hear from older tanks. With 949,097 households in the metro drawing on heaters of every age, the failures follow the same order — recovery slows, hot water runs out earlier, then rust or a leak at the base announces the tank itself. Flushing a tank while it is still sound, and replacing the anode rod that sacrifices itself against corrosion, are the maintenance steps that decide whether a heater reaches the long end of its expected life or gives up early.
Recovery time is the number that runs a household's mornings, and it is the first thing sediment steals. A tank rated to serve a family when new delivers less hot water per heating cycle every year as the sediment layer thickens and the burner's work goes into heating rock instead of water. In San Antonio, where summer demand piles showers, laundry and dishwashing into the same hours, that slow decline shows up as a household quietly rationing hot water without ever deciding to. Flushing the tank returns some of it; a spent anode and a rumbling, scaled tank are the signs the decline has become structural, and the conversation turns to replacement.
Do the local sums: 949,097 households heating water through 3,148 cooling degree days and 1,438 heating degree days a year means the metro's heater fleet cycles relentlessly, and sediment settles further with every cycle. Heaters in San Antonio rarely die young — they die on schedule, and the schedule is written by how hard the climate makes them work and whether anyone ever drained the sediment out of the tank.
Summer in San Antonio is a workload season for plumbing: water heaters serving long strings of showers and laundry, slab soil drying and shifting under foundations, and households at home more hours of the day using every fixture. The checks that matter are small ones — a heater flushed before the season, a watched water bill, an ear out for the meter running at night.
Summer is when this metro's plumbing works its longest shifts. Demand peaks with the temperature — 122.4 days at 90 or above at SAN ANTONIO INTL AP, TX US — and the systems that fail in the heat fail under load: heaters cycling without rest, fixtures at holiday usage, slab soil dried and shifting under the tracts. The season is also when small weaknesses become appointments, because nobody postpones a plumbing problem with a house full of guests and the mercury where it is.
Slab leaks map onto San Antonio's growth pattern with unusual precision. The leaks live where the slabs are: the post-war subdivisions, the boom-era tracts around San Antonio, and the 412,860 homes built since 2000 on concrete. Pier-and-beam and basement homes in the older districts have their own leak problems, but they announce them visibly — it is the slab stock that hides its failures under flooring. Within a slab neighbourhood the risk is shared: same builder era, same soil, same line materials, which is why one confirmed leak on a street reasonably raises the alertness of every house on it.
Why here and not everywhere: San Antonio pairs 351,657 pre-1980 homes with 122.4 days a year at 90 degrees or more and 14.0 nights below freezing. Every metro pairs its housing with its weather somehow; this particular pairing is what puts the pattern where it sits on this page's list, ahead of problems that dominate metros built in other decades, under other skies.
Experienced local practice starts with the simple certainties — the observations that take minutes and decide the most:
 PROBLEM
 SOLUTION
Population 1,458,954
Population 98,700
Population 43,128
Population 34,980
Population 33,829
Population 32,924
Population 31,789
Population 28,764
Population 19,853
Population 19,509
Population 15,875
Population 11,479
Also in the San Antonio metro: Selma (population 11,302), Pleasanton (population 10,854).
The communities in the grid are not suburbs of the page; they are its subject as much as San Antonio is. New Braunfels (98,700 residents) and Schertz (43,128) carry their own building decades, their own pipe materials and their own positions in the problem ranking's logic — a lateral under a New Braunfels street answers to the same data as one in the centre, but to a different era of it. Coverage here is defined by the ZIP list below; understanding is defined street by street, and this page's figures are the metro-wide version of a story each community tells in its own numbers.
Beyond the largest communities sit Timberwood Park (34,980), Cibolo (33,829), Canyon Lake (32,924), Seguin (31,789), Converse (28,764) — smaller places across Atascosa, Bandera, Bexar, Comal, Guadalupe, Kendall, Medina, Wilson, covered on the same terms. Their housing tends to be older on average than the big suburbs', and their calls follow the older patterns on this page. One routing covers them all: find your ZIP code below and the rest is a phone call.
Every metro has a first city and a supporting cast, and the census figures draw the billing plainly here: San Antonio first, with 1,458,954 residents; New Braunfels second at 98,700; Schertz third at 43,128; then the long tail of smaller communities in the grid above. The billing matters less than the building dates — each of these places was plumbed in its own decade, by its own builders — but between them they account for nearly every housing era, material and failure pattern this page describes.
Administratively the metro is drawn from Atascosa, Bandera, Bexar, Comal, Guadalupe, Kendall, Medina, Wilson — 8 in all — with Atascosa County at its centre. County lines do not change pipe physics, but they do shape the paperwork around the work: permits, inspections and code details are county and city business, which is one reason the professional who serves your street is a local one.
This page ends at the metro boundary, but the region does not: Austin, TX, Killeen–Temple, TX and Laredo, TX continue the coverage in their own directions, each with a profile built from its own Census and NOAA figures. If your home sits near the line between metros, go by your ZIP code — it places you in the dataset that describes your housing.
The region around San Antonio is a set of variations on its theme: Austin, TX, 72 miles off, runs a median build year of 2000 on a metro population of 2,620,945; Killeen–Temple, TX (126 miles) medians 1993 on 511,497; Laredo, TX (129 miles) medians 1996 on 281,224. Nearness is not sameness — a few decades of median build year separate their plumbing as surely as the miles separate their maps.
Count the metro per unit of itself: 8,573 housing units per covered ZIP code; 118,637 households per county; 14 communities sharing 8 county governments. Then weigh the generations against each other — 0.9 older homes for each newer one — and the service pattern on this page stops being a list and becomes a proportion: that much of the diary written by ageing systems, the rest by young ones wearing in.
San Antonio by the derived numbers — median home age 34 years · owners in 602,677 homes, renters in 346,420 · each covered ZIP code carrying about 1,235 pre-1960 homes · a heating-to-cooling degree-day ratio of 0.46 · 822 mm average annual rainfall.
Before an emergency, read the guide: How to shut off your home's water main
Describe the problem and the call center routes you to an independent local plumber who works in the San Antonio metro.
Call center hours: Mon-Fri 7:00 AM-10:00 PM ET | Sat 8:00 AM-10:00 PM ET | Sun 7:00 AM-9:00 PM ET