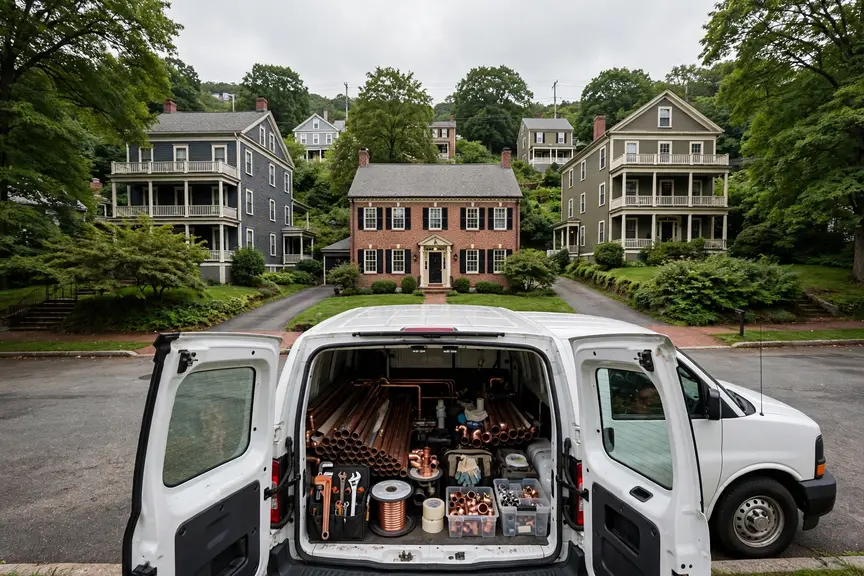


This is Worcester's plumbing page, built from Worcester's own numbers: Census housing figures, the metro's ZIP codes and its NOAA climate record. PlumbReach USA routes your call to an independent local plumber; the homework below is here so you know your home's likely problems before you ever make it.
Call center hours: Mon-Fri 7:00 AM-10:00 PM ET | Sat 8:00 AM-10:00 PM ET | Sun 7:00 AM-9:00 PM ET
The median Worcester home was built in 1966; 64.7% of the stock predates 1980, and the pattern this metro's own data ranks first is ageing cast iron sewer lines. PlumbReach USA is a referral service, not a plumbing company: one call connects you with an independent local plumber serving your ZIP code.
The stock, in one pass: 861,664 residents, 353,405 housing units, 333,273 households — and a build history that splits the metro into plumbers' generations. 44.6% of homes stand from before 1960; 64.7% from before 1980; the rest divide between the late-century suburbs and the 14.1% built since 2000. Every era is a materials decision still in force: the pipes in a Worcester wall are the ones its decade specified, ageing on that decade's schedule, whatever the current owner's plans for them.
Stand in one of Worcester's older neighbourhoods and you are standing in its plumbing's back catalogue. The homes there — part of the 228,653 built before 1980 across this metro — went up when galvanized steel was a supply line, cast iron or clay was a drain, and a fixture was expected to serve for half a century. That half-century has now elapsed. What it leaves behind is not universal failure but universal exposure: every joint, valve and lateral in those districts is operating past the horizon its makers planned for, in Worcester County and beyond, and the failures arrive in the order the materials tire.
Growth wrote this metro's newest plumbing chapter in plastic and concrete: supply and drain lines in modern materials, fixtures by the catalogue, foundations poured as slabs across the subdivisions near Leominster and Fitchburg. The chapter is young — its systems have decades in hand — but it is not exempt from the metro's arithmetic: 502 cooling degree days of demand work its heaters hard, and the soil under its slabs moves with the same seasons as the soil under the oldest farmhouse in Worcester County.
The climate written over all of it comes from the NOAA station at WORCESTER RGNL AP, MA US: an average year brings 6,622 heating degree days, 502 cooling degree days and 48.26 inches of precipitation. Those are not abstractions to a buried pipe or an exposed line — they set how often soil around a sewer lateral swells and shrinks, how hard a water heater cycles in January and July alike, and whether an uninsulated garage line is a worry or a certainty. The problem sections that follow are selected by exactly these numbers, combined with the housing-age profile above.
Two public records, one metro: what was built here, and what the sky does to it.
Lay the eras side by side instead: 44.6% pre-1960 (157,619 homes), 20.1% from 1960-1979 (71,034), 21.3% from 1980-1999 (75,275), and 14.1% since 2000 (49,830). No single era tells the story — the proportions among them do, and those proportions are different in every metro this site covers.
This is, by the numbers, an old-system metro. The largest slice of its housing predates 1960, which means the typical serious job here involves materials in their seventh decade or beyond: drains of cast iron or clay, supply runs in galvanized steel, laterals laid when the streets themselves were young. The newer bands exist — the growth since 2000 is real — but they are the supporting cast. Worcester's plumbing identity was fixed by its earliest builders, and its problem list is written in their materials.
The runner-up era is 1980-1999, with 21.3% of homes. That stock has left its carefree decades and entered its maintenance decades, and it shows in the call pattern around Leominster and the other districts of those years: heaters on their second or third cycle, fixtures reaching their wear points together, drains still young enough to reward attention over replacement.
Translate the climate record into plumbing terms and it comes out as three working conditions. Condition one, the freeze count — 129.7 nights a year when exposed water can solidify and split its container. Condition two, the heat count — 2.9 days that load drains, heaters and tempers simultaneously. Condition three, the water itself: 48.26 inches of it arriving from the sky to move the soil around every lateral in the metro. Worcester's systems are engineered, installed and aged inside those three conditions, and their failures carry the conditions' fingerprints.
Hold the two halves together and the rest of this page explains itself: the problems ranked highest here are the ones where Worcester's dominant housing era and its climate record overlap. Change either dataset and the ranking changes — which is precisely why this profile is rebuilt from the records for every metro instead of carried over from the last one.
Chosen by this metro's own housing and weather data — the same two records this whole page is built from.
Cast iron was the standard sewer material for homes built through the middle of the last century, and Worcester still has a great deal of it underground: 44.6% of homes here were built before 1960 and 64.7% before 1980. Cast iron does not fail all at once. It corrodes from the inside out, the bottom of the pipe thinning and scaling until waste catches on the rough surface, and a line that drained freely for decades starts slowing, then backing up. By the time roots find the joints of an old cast iron line, the pipe wall around them is often too thin for cleaning alone to be the whole answer. A camera inspection shows exactly how much good pipe is left: scaling near the top of the line may clean up well, while a channel rotted along the bottom means that section is living on borrowed time. Homeowners in Worcester with a pre-1960 house and drains that misbehave through the whole home — not just one fixture — are usually looking at this story, and the sensible first step is a camera look before another cleaning is booked.
The pipe itself explains the timeline. Cast iron drains by gravity, slowly, and everything a household sends down it — grease films, mineral-heavy water, the occasional corrosive cleaner — works on the iron for decades. The metal does not fail evenly: it thins first at the bottom of horizontal runs, where water and grit sit longest, and at the joints where sections meet. That is why two Worcester homes of the same age can be in different places with the same pipe: usage, water chemistry and soil conditions around the line all vote on how fast it goes. What a camera inspection adds is certainty — the difference between a line that needs cleaning, a line that needs a section replaced, and a line living on borrowed time.
The local weight of it: 157,619 homes in this metro predate 1960, and while some have renewed their drains since, every original line still serving is past the age its installers planned for. That is a population of risk no single street explains — it is the metro's founding stock, failing on a schedule set in the post-war decades.
Run two taps at once in a galvanized house and the second one apologises. That is the material's signature in old age: rust accreting inside the bore until the pipe delivers a fraction of its designed flow, weakest at the far end of the run. Worcester carries 228,653 pre-1980 homes, and the ones still on original galvanized announce themselves the same way — pressure that fades year by year, water that runs tea-coloured after a quiet weekend. Repiping is simply the moment the household stops negotiating with the symptom and replaces the cause.
The geography of galvanized failure inside one house is uneven, and the unevenness misleads people. The runs nearest the water heater corrode fastest, worked by heat; long horizontal runs narrow differently from vertical risers; the line to a little-used guest bathroom may be nearly closed while the kitchen still flows. This is why a Worcester home can seem fine at most taps while one shower has given up entirely. Repiping answers the whole geography at once, which is its real argument: not that any single run has failed, but that the system's remaining life is scattered unevenly through every wall, and spot repairs keep buying the shortest-lived section.
The replacement side of the ledger is equally local: when a Worcester home of the galvanized era is sold, inspected or renovated, the supply lines are among the first systems examined — because everyone in the local trade knows the material's age here. A pattern the whole market has learned to look for is not an anecdote; it is the metro's housing data wearing a tape measure.
There is a particular silence after a hard freeze in Worcester: the pause while households open taps one by one, auditing the night. Most winters, most homes pass. The failures cluster where they always cluster — the addition plumbed in a hurry across a crawl space, the garage wall line, the hose bibb nobody drained — because cold air is a systematic inspector and it works from a list. The record at WORCESTER RGNL AP, MA US guarantees the inspection recurs: this is not a freak-weather problem but a standing appointment between the climate and the metro's least-protected pipework, kept every year whether the household remembers it or not.
A burst pipe is rarely about the coldest night of the year; it is about the one unprotected run of pipe the cold can reach. Water expands as it freezes, and the pressure that splits a line is not the ice itself but the water trapped between the ice blockage and a closed tap. Lines in exterior walls, unheated crawl spaces, garages and hose bibbs are the usual victims — the places where a home's heating never quite arrives. Worcester's older housing carries more of these runs than its newer builds, which route water through conditioned space by design. The thaw is when the damage shows: the split may weep for hours before anyone is home to hear it, which is why the shutoff advice on this page matters more than any repair.
Two local numbers frame the risk: 129.7 nights a year at or below freezing at WORCESTER RGNL AP, MA US, against a housing stock whose median home dates to 1966 — plumbed, much of it, before routing lines away from cold air was standard practice. Exposure is the product of those two numbers, and in this metro the product is large.
A lateral ages in the dark, at the pace of the ground around it. Soil creeps; bedding washes grain by grain toward the street; joints laid generations ago in Worcester's older districts step a fraction out of true and stay there, catching what the household sends down. Nothing about this is dramatic from inside the house — until the day the accumulated fractions add up to a line that no longer falls cleanly to the main. That day announces itself downstairs, at the ground-floor fixture, the way it always has: the private sewer reporting, at last, in public.
Slope is the lateral's invisible specification. A sewer line does not need much fall — a quarter inch per foot is the classic figure — but it needs it consistently, and ageing takes consistency away: a section settles, a joint steps down, and the line develops a reach where flow slows and solids settle out. That belly then collects a little more each week, narrowing the line from the bottom up. Many a Worcester lateral diagnosed as 'blocked' is really 'bellyed' — clearable today, certain to collect again. The camera distinguishes the two, and the distinction decides whether the household is booking a cleaning or planning a repair.
The census figures draw the map: 157,619 homes from before 1960 and a median build year of 1966 mean the typical lateral in Worcester has been buried for decades, and the oldest have passed the service life their materials were expected to give. Multiply one buried line by 353,405 housing units and the pattern's rank on this page stops being surprising.
Winter in Worcester is pipe season. With about 129.7 nights a year at or below freezing on the long-term record, the houses that get through winter cleanly are the ones whose exposed lines were dealt with in autumn: insulation on garage and crawl-space runs, hoses off the outside taps so those lines can drain, and a household that knows where its main shutoff is before it needs it. During the hardest cold, a slow drip from the tap furthest from the main and open cabinet doors under sinks on outside walls are simple insurance. If a line does freeze, shut the water off before the thaw does its damage and have the run checked — a pipe that froze once has shown you exactly where it is vulnerable.
Put the season in figures: 129.7 freezing nights a year at WORCESTER RGNL AP, MA US, against a median build year of 1966. Half of Worcester's homes are that old or older, and their exposed lines sit the winter's examination every year — the failures the season produces are simply the papers it fails.
The telltale geography here is generational. Cast iron under a Worcester street means the street predates the metro's plastic era — the blocks around Worcester first, the early suburbs second, almost nothing built after the material left standard practice. A homeowner in those blocks owns a drain in its eighth or ninth decade, and the diagnostic question is never whether the iron has corroded — it has — but how far the corrosion has travelled: a section, a run, or the whole line to the street. Cameras answer it street by street, house by house, and the answers in the oldest blocks rhyme closely enough that experienced local plumbers can often predict the footage before they see it.
Read the ranking backwards and it reads as a data summary: 861,664 residents in 353,405 housing units, 44.6% of the housing from before 1960, 48.26 inches of rain in an average year. The pattern leads because the exposure is broad — counted not in individual unlucky houses but in whole eras of the metro's building, stacked one on another.
The first visit follows a short, diagnostic list — each item ruling a branch of the problem in or out:
Listed in the order this metro's housing and climate data supports.
Roots, offsets, bellies, corrosion — the camera distinguishes them, and each has a different remedy at a different scale. That is the whole logic of sewer work: see the line first, then decide whether it needs a clearing, a section, or a new run entirely.
Put the metro's laterals end to end and they would run for thousands of miles — one private road per home, most of them laid generations ago and none of them inspected since. Worcester's share of that buried network follows its building history: clay and iron under the founding districts, transitional materials in the post-war ring, plastic in the growth corridors around Leominster. Sewer service here is the slow audit of that network, one camera run at a time, and its findings sort themselves by era so reliably that the footage often confirms the street's building date before it confirms anything else. It is why two Worcester homes of the same age, on different streets, so often need the same visit in the same year.
Under Worcester lie 353,405 laterals, one per housing unit, and the oldest of them — beneath the 157,619 pre-1960 homes — have been underground since the metro was a fraction of its present size. The camera diary in Leominster and the old core is written by that buried generation.
Pipes fail in two tenses: suddenly, at a joint or a split, and gradually, as a material narrows, thins or pits across a whole system. The first tense asks for a repair; the second eventually asks the larger question. Pipe services cover both — the sectional fix that restores a sound system, and the planned renewal that replaces a failing material through the whole house, routed to spare the building and staged to keep the household in water.
The repiping conversation in Worcester starts with its housing data: median build year 1966, 64.7% of homes from before 1980, and whole districts plumbed in materials that are now at or past their expected service lives. Galvanized lines in the older neighbourhoods have been narrowing from the inside for decades; the symptom homeowners notice — pressure fading year by year — is the pipe's inner diameter closing. One pinhole in that stock is an event; the third is a pattern, and the plumbers who work Worcester and the older core will say so plainly rather than sell a fourth repair. The WORCESTER RGNL AP, MA US record — 6,622 heating degree days, 502 cooling — is the backdrop Worcester County plumbers plan around.
Pipe work divides by era in this metro with unusual neatness: renewal conversations in the 228,653 pre-1980 homes, sectional repairs in the middle ring, and near-silence from the 49,830 post-2000 homes whose lines are still young. A call from Milford can sit in any of the three bands; the home's build year says which before the door opens.
In a metro of 353,405 homes with a median build year of 1966, water heaters fail in waves as whole streets age together — the plumbers serving Worcester stock and schedule for exactly that pattern.
Emergencies in Worcester are answered by local independents, not a dispatch centre: PlumbReach USA routes the call, and the stock it serves — 353,405 homes across 85 ZIP codes — is the stock this page profiles.
Worcester's drains are cleared by local independents who work this stock weekly: a median build year of 1966 means most lines they open have decades of history in them, and the clearing approach is chosen for the era, not the postcode.
A creeping meter in a Worcester home is located, not guessed at: the professionals routed here trace the line with instruments and confirm the spot before any floor or wall is opened.
Running, rocking or refusing — in Worcester the diagnosis is the same short sequence: fill valve, flapper, supply line, flange. The plumbers routed here carry the internals for the fixtures this metro's eras installed.
Fixture work in Worcester divides by era like everything else on this page: washer-era taps in the older districts, cartridge internals in the post-2000 subdivisions — the local plumber stocks for both.
If this page's services were ranked by Worcester's call patterns rather than listed in catalogue order, they would come out much as they do here — because the ranking behind them is data, not habit. Ageing cast iron sewer lines leads the metro's problem table and galvanized pipes at the end of their life follows, so the services answering them lead the list. The long tail of a metro's plumbing life — fixture failures, toilet calls, the single unexplained leak — fills in the diary around them, here as everywhere.
 PROBLEM
 SOLUTION
Population 205,501
Population 43,697
Population 41,633
Population 27,919
Population 21,075
Population 17,806
Population 12,300
Population 8,711
Population 7,250
Population 6,908
Population 6,720
Population 5,572
Also in the Worcester metro: Spencer (population 5,520), Winchendon (population 4,407).
A metro is a federation of building decades wearing one name, and the grid above is Worcester's federation: Worcester at the centre, Leominster (43,697 residents) and Fitchburg (41,633) in the next ring, and the smaller communities beyond, down to places a few thousand households deep. What unites them is one climate record and one routing; what divides them is the year their streets were plumbed. The ZIP list that follows is the practical definition of that federation — if your code is on it, your home's era is part of the data this page was built from.
Beyond the largest communities sit Milford (27,919), Gardner (21,075), Southbridge Town (17,806), Webster (12,300), Athol (8,711) — smaller places across Worcester, covered on the same terms. Their housing tends to be older on average than the big suburbs', and their calls follow the older patterns on this page. One routing covers them all: find your ZIP code below and the rest is a phone call.
Every metro has a first city and a supporting cast, and the census figures draw the billing plainly here: Worcester first, with 205,501 residents; Leominster second at 43,697; Fitchburg third at 41,633; then the long tail of smaller communities in the grid above. The billing matters less than the building dates — each of these places was plumbed in its own decade, by its own builders — but between them they account for nearly every housing era, material and failure pattern this page describes.
The metro answers to 1 county governments (Worcester), a patchwork that matters at permit time rather than at the pipe. Worcester County carries the centre; the others carry the growth rings and the older outlying towns. A plumber routed through this page works inside that patchwork daily — the water does not care about the boundaries, but the job's paperwork does.
Beyond the metro line, the nearest covered metros are Amherst, MA (37 miles away), Springfield, MA (38 miles) and Boston, MA (49 miles) — separate pages, separate profiles, because their housing and weather records are their own. Homeowners near the boundary sit between two datasets; the ZIP list above, not the map's edge, decides which page was written about your stock.
The region around Worcester is a set of variations on its theme: Amherst, MA, 37 miles off, runs a median build year of 1970 on a metro population of 164,065; Springfield, MA (38 miles) medians 1958 on 464,338; Boston, MA (49 miles) medians 1963 on 5,034,221. Nearness is not sameness — a few decades of median build year separate their plumbing as surely as the miles separate their maps.
Divide the stock by the map and the densities appear: roughly 4,158 housing units for every covered ZIP code, 333,273 households to a county, 14 named communities in the grid. The balance between the generations reads 4.6 pre-1980 homes for every home built since 2000 — a single ratio that quietly predicts whether a metro's plumbing week leans toward renewal work in the old districts or first-generation upkeep in the new ones.
The Worcester record in one line — median home age: 60 years · owner-occupied homes: 218,960 · renter-occupied homes: 114,313 · pre-1960 homes per covered ZIP code: 1,854 · heating-to-cooling degree-day ratio: 13.18 · average rainfall: 1,226 mm a year.
Before an emergency, read the guide: How to shut off your home's water main
One call connects you with an independent local plumbing professional serving Worcester and the surrounding metro.
Call center hours: Mon-Fri 7:00 AM-10:00 PM ET | Sat 8:00 AM-10:00 PM ET | Sun 7:00 AM-9:00 PM ET