

Home / Cities / Iowa / Waterloo

Plumbing Services in Waterloo, IA

PlumbReach USA connects Waterloo homeowners with independent local plumbers. This page is built from the metro's own Census housing data, ZIP codes and climate record — the plumbing problems described here are the ones Waterloo homes actually have.

Call center hours: Mon-Fri 7:00 AM-10:00 PM ET | Sat 8:00 AM-10:00 PM ET | Sun 7:00 AM-9:00 PM ET

29
ZIP codes covered
3
Counties in the metro
68,518
Households (Census ACS)
1966
Median year home built
Waterloo, IA — the metro skyline and landscape
Waterloo, IA — plumbing help across the metro
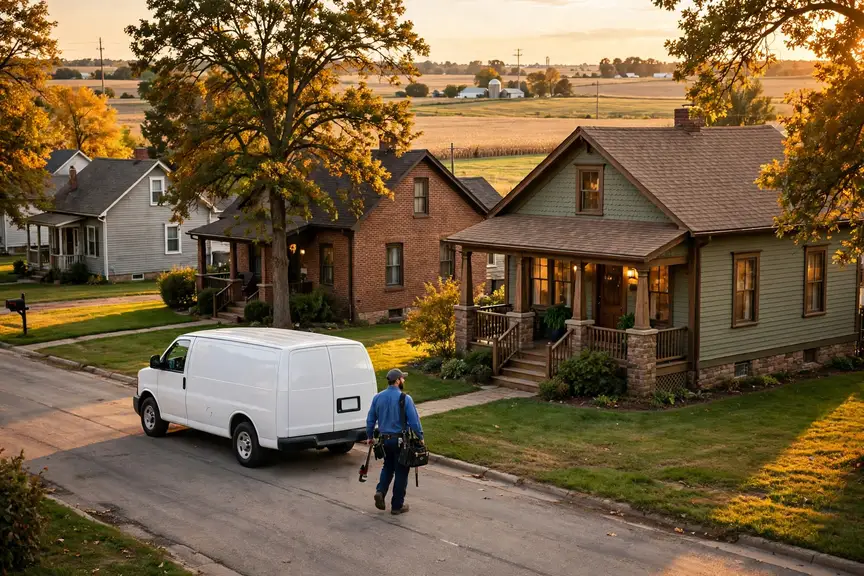
A local plumber's van on a residential street
Local plumbers serving Waterloo neighbourhoods
Water heater installation in a home garage
Heater calls follow the housing eras in Waterloo

Waterloo plumbing, in brief

The median Waterloo home was built in 1966; 70.8% of the stock predates 1980, and the pattern this metro's own data ranks first is ageing cast iron sewer lines. PlumbReach USA is a referral service, not a plumbing company: one call connects you with an independent local plumber serving your ZIP code.

The Waterloo housing stock, and what it means for plumbing

Read Waterloo through its counties and the picture sharpens. Black Hawk, Bremer, Grundy were not built in the same decades or for the same households, and their plumbing carries those differences: an older core where 42.0% of the metro's homes predate 1960, growth corridors where the subdivisions arrived in waves, and edges still being built out. The metro-wide medians — a middle home built in 1966, 74,779 housing units in all — are the average of those local stories, and the sections below are organised by the patterns the combined record produces, from the oldest pipe materials to the newest failure modes.

Stand in one of Waterloo's older neighbourhoods and you are standing in its plumbing's back catalogue. The homes there — part of the 52,944 built before 1980 across this metro — went up when galvanized steel was a supply line, cast iron or clay was a drain, and a fixture was expected to serve for half a century. That half-century has now elapsed. What it leaves behind is not universal failure but universal exposure: every joint, valve and lateral in those districts is operating past the horizon its makers planned for, in Black Hawk County and beyond, and the failures arrive in the order the materials tire.

The newer side of Waterloo — the 15.8% of homes built since 2000, concentrated around growing communities like Waterloo — runs on plastic supply and drain lines that age more gracefully but fail in their own ways: slab leaks where lines run under concrete, water heaters worked hard by 918 cooling degree days of hot-season demand, and fixture cartridges wearing out in houses that all reach the same age at the same time. One metro, two plumbing generations, and the sections below take them in the order this metro's data ranks them.

The weather's part in this is written at WATERLOO MUNI AP, IA US, where an average year carries 36.29 inches of precipitation, 15.3 days at ninety degrees or more and 150.5 nights at freezing or below. Pipes experience that year as workload and as hazard in roughly equal measure — the workload in the heater's cycle count and the drains' burden, the hazard in the exposed runs and the swelling soil. The problem ranking further down is simply the housing profile above, read under this sky.

The Waterloo plumbing profile in numbers

The metro's building eras on one side, its weather record on the other — and its plumbing where the two meet.

Lay the eras side by side instead: 42.0% pre-1960 (31,407 homes), 28.8% from 1960-1979 (21,536), 13.4% from 1980-1999 (10,020), and 15.8% since 2000 (11,815). No single era tells the story — the proportions among them do, and those proportions are different in every metro this site covers.

This is, by the numbers, an old-system metro. The largest slice of its housing predates 1960, which means the typical serious job here involves materials in their seventh decade or beyond: drains of cast iron or clay, supply runs in galvanized steel, laterals laid when the streets themselves were young. The newer bands exist — the growth since 2000 is real — but they are the supporting cast. Waterloo's plumbing identity was fixed by its earliest builders, and its problem list is written in their materials.

The second band in the table is the 1960-1979 stock: 21,536 homes, 28.8% of the metro. It is the transition generation — copper arriving, galvanized lingering, drains mixed street by street — and it supplies Waterloo with its most diagnostic plumbing: two homes of the same year needing opposite answers, decided by what the builder happened to specify.

A profile needs its climate column, and Waterloo's comes from WATERLOO MUNI AP, IA US: an average year of 49.0 degrees, built from extremes at both ends. The heating load (6,714 degree days) and the cooling load (918) together set the water heater's working life; the precipitation total (36.29 inches) sets the soil's behaviour around every buried line; the freeze count (150.5 nights) sets the exposure of every uninsulated run. Four numbers — and most of the metro's plumbing behaviour follows from them.

That is the whole method of this page in one section: era shares from the Census, loads from NOAA, and a problem list that is simply where the two overlap most in Waterloo. The services and guidance that follow are ordered by the same profile — local first, generic last.

Plumbing services in Waterloo

Sequenced by this metro's own problem ranking, not by a national catalogue order.

Sewer Line Repair & Replacement in Waterloo

The sewer line is the one pipe every fixture in the house shares, and the only one whose failure backs up into the home instead of draining away from it. Its enemies are time, roots and soil movement, working at the pace of decades. Service on the line begins with evidence — camera footage of its actual condition — because the difference between a cleaning, a sectional repair and a replacement is written inside the pipe, not in the symptom at the drain.

A lateral's enemies in Waterloo are patient and they are local: roots working the joints under the canopy streets of Black Hawk County, soil that swells with 36.29 inches of yearly rain and shrinks back in the dry stretches, and plain elapsed time in the districts where the pipe predates the pavement above it. Against enemies that slow, the camera is less a diagnostic luxury than the only honest calendar the line will ever get — footage that says whether the pipe has years left, or has been spending them. The remedy scales to that verdict and to no other. From Cedar Falls to Waverly, the pattern repeats wherever the housing era matches.

Under Waterloo lie 74,779 laterals, one per housing unit, and the oldest of them — beneath the 31,407 pre-1960 homes — have been underground since the metro was a fraction of its present size. The camera diary in Cedar Falls and the old core is written by that buried generation.

More about sewer line repair & replacement ➔

Pipe Repair & Repiping in Waterloo

Every pipe material carries a lifespan, and pipe services are how a house changes generations. Sectional repair buys time on a sound system; full repiping retires a tired one, replacing choked or pitting lines wall by wall and leaving the household with pressure and water quality it may not have had in years.

A repipe decision in Waterloo is usually made at a kitchen table, from three exhibits: the water's behaviour at the taps, the count of repairs already paid for, and the material visible wherever the system shows itself. Exhibits like those persuade because they are the household's own. The work itself, when it comes, is less disruptive than its reputation — modern lines route through attics, closets and chases, water stays on for most of the project, and the plaster sacrificed is measured in patches, not rooms. What the household buys back is the thing the old material had been taxing away: pressure, clarity, and the right to forget the pipes exist. Locally the workload concentrates where the stock is oldest — the districts built around the 1960s first.

The repair-or-renew caseload is set by one figure above the rest: 70.8% of Waterloo homes predate 1980, plumbed in the materials now at the end of their service lives. Around Evansdale (4,530 residents) as in the old core, that percentage is not an abstraction — it is the street's plumbing, house by house.

More about pipe repair & repiping ➔

Water Heater Repair & Installation in Waterloo

In a metro of 74,779 homes with a median build year of 1966, water heaters fail in waves as whole streets age together — the plumbers serving Black Hawk, Bremer, Grundy stock and schedule for exactly that pattern.

More about water heater repair & installation ➔

Emergency Plumbing in Waterloo

Emergencies in Waterloo are answered by local independents, not a dispatch centre: PlumbReach USA routes the call, and the stock it serves — 74,779 homes across 29 ZIP codes — is the stock this page profiles.

More about emergency plumbing ➔

Drain Cleaning in Waterloo

Drain work in Waterloo splits by era: the 52,944 pre-1980 homes drain through older materials, the post-2000 subdivisions through plastic — and the local plumber reads the cable's return to tell which world your street drains through.

More about drain cleaning ➔

Leak Detection & Repair in Waterloo

A creeping meter in a Waterloo home is located, not guessed at: the professionals routed here trace the line with instruments and confirm the spot before any floor or wall is opened.

More about leak detection & repair ➔

Toilet Repair & Installation in Waterloo

Toilet calls in Waterloo are the small end of the diary and the most democratic: every era of the 74,779-home stock produces them, and the local fix starts with the mechanism in the tank, not the porcelain.

More about toilet repair & installation ➔

Faucet, Fixture & Garbage Disposal Repair in Waterloo

Fixture work in Waterloo divides by era like everything else on this page: washer-era taps in the older districts, cartridge internals in the post-2000 subdivisions — the local plumber stocks for both.

More about faucet, fixture & garbage disposal repair ➔

What Waterloo books most

If this page's services were ranked by Waterloo's call patterns rather than listed in catalogue order, they would come out much as they do here — because the ranking behind them is data, not habit. Ageing cast iron sewer lines leads the metro's problem table and galvanized pipes at the end of their life follows, so the services answering them lead the list. The long tail of a metro's plumbing life — fixture failures, toilet calls, the single unexplained leak — fills in the diary around them, here as everywhere.

Plumbing problems Waterloo homes actually get

Ranked for this metro alone, from its Census housing profile and NOAA climate record.

Ageing cast iron sewer lines

Cast iron was the standard sewer material for homes built through the middle of the last century, and Waterloo still has a great deal of it underground: 42.0% of homes here were built before 1960 and 70.8% before 1980. Cast iron does not fail all at once. It corrodes from the inside out, the bottom of the pipe thinning and scaling until waste catches on the rough surface, and a line that drained freely for decades starts slowing, then backing up. By the time roots find the joints of an old cast iron line, the pipe wall around them is often too thin for cleaning alone to be the whole answer. A camera inspection shows exactly how much good pipe is left: scaling near the top of the line may clean up well, while a channel rotted along the bottom means that section is living on borrowed time. Homeowners in Waterloo with a pre-1960 house and drains that misbehave through the whole home — not just one fixture — are usually looking at this story, and the sensible first step is a camera look before another cleaning is booked.

Look inside an old cast iron line with a camera and the failure stops being abstract. The inner wall grows rough with tuberculation — rust nodules that narrow the bore and catch everything passing. The bottom of the run, where water and grit travel, thins fastest; the top can look sound while the channel below it is nearly through. Roots enter at joints and add their own blockage. A Waterloo line of this vintage is therefore not one problem but a profile of problems along its length, and the repair that makes sense — cleaning, a section, a full replacement — is the one matched to the worst ten feet the camera finds, not the average of the whole run.

Count it from the Census side: 31,407 homes in this metro predate 1960, and the drain lines beneath them were cast in an era that assumed a working life now fully spent. They will not all fail at once — they will fail one street at a time, in the order the corrosion reaches, which is what makes the pattern a ranking on this page rather than a footnote.

Watch for

  • Whole-house slow drains in a home built before 1960
  • Backups that return within months of a cleaning
  • Sewer odour near the yard or a soggy strip of lawn

About sewer line repair & replacement ➔

Galvanized pipes at the end of their life

There is a diagnostic shortcut for galvanized systems, and it is a white bucket. Fill it at a tap after the house has sat quiet overnight: the first draw runs tea-coloured with the rust the lines have shed, clearing as fresh water arrives. It is a small experiment with a large meaning — the pipe's interior is dissolving into the water it carries. Across Waterloo, homes plumbed in the galvanized decades run that experiment daily whether they look at the bucket or not. One home's result is a curiosity; the same result with falling pressure and returning leaks is the material's resignation letter.

Galvanized pipe fails politely, which is exactly the problem — it gives a household years of small warnings that are easy to live with. The zinc coating that once protected the steel wears through, rust takes its place, and the rust grows inward like a narrowing artery. Flow to the farthest fixtures drops first. A shower that shares a line with a running tap loses its pressure. By the time the water itself runs discoloured after the house has sat quiet overnight, the narrowing is well advanced. None of this is a single emergency; it is a system reaching the end of its design life on schedule, and in Waterloo's pre-1980 neighbourhoods that schedule is arriving for whole streets at once, because the pipes went in together.

The replacement side of the ledger is equally local: when a Waterloo home of the galvanized era is sold, inspected or renovated, the supply lines are among the first systems examined — because everyone in the local trade knows the material's age here. A pattern the whole market has learned to look for is not an anecdote; it is the metro's housing data wearing a tape measure.

Watch for

  • Pressure fading gradually across the whole house
  • Rusty water after the taps sit unused
  • Repairs needed more often, in more places

About pipe repair & repiping ➔

Freeze-burst pipes in cold snaps

Ice does its damage in silence and announces it in flood. The split forms under pressure while the line is frozen, holds while the ice plug seals it, and opens the moment the thaw restores flow — which is why burst pipes are so often discovered by sound: water running somewhere it should not be, in a house that was intact at breakfast. Waterloo's exposure sits where its housing does — in the older districts' unprotected runs and every era's additions and garages — and the repair visit's second job, after the pipe itself, is the insulation and routing that keep the same night from repeating.

Prevention, for this pattern, is a geography lesson: the burst never happens in the middle of the heated house. It happens at the perimeter — the wall cavity on the windward side, the run beneath the addition, the pipe the builder routed through the garage to spare six feet of copper. In Waterloo, where 15.3 summer days tempt everyone to forget what 150.5 freezing nights intend, the autumn ritual is short and specific: find every line that leaves the warmth, and do something about it. The households that keep that ritual read about burst pipes the way other people do — as news.

Two local numbers frame the risk: 150.5 nights a year at or below freezing at WATERLOO MUNI AP, IA US, against a housing stock whose median home dates to 1966 — plumbed, much of it, before routing lines away from cold air was standard practice. Exposure is the product of those two numbers, and in this metro the product is large.

Watch for

  • A pipe that froze during a cold snap, even if it did not burst
  • Water stains appearing as temperatures rise after a freeze
  • Exposed lines in garages, crawl spaces or outside walls

About pipe repair & repiping ➔

Winter pipe season in Waterloo

This is the season the metro's housing stock is examined by the weather, and the examination is practical: every exposed run, every unheated void, every shutoff nobody has tested. The failures arrive in batches behind the hardest nights and announce themselves at the thaw. The rest of the season grades the slower systems too — heaters working against the coldest incoming water of the year, laterals under frozen ground — but the headline the season writes, year after year, is the sound of water in a wall that should be dry.

Winter's load on this metro can be counted two ways: in the 150.5 freezing nights WATERLOO MUNI AP, IA US records, and in the age of the housing that must withstand them — half of it built by 1966 or earlier. Neither number alone predicts a burst; multiplied together, they predict a season. Local plumbers plan their winter around that product, and households in the older districts do well to plan their autumn the same way.

A closer look: ageing cast iron sewer lines in Waterloo

There is a reason this pattern tops so many old-metro lists, and Waterloo holds the reason in bulk: iron was simply what drains were, for the whole first age of indoor plumbing. Every pre-1960 home still on its original line — and the Census counts 31,407 pre-1960 homes here — is running an experiment in how long buried iron can serve. The results arrive unevenly: one street's lines camera clean and sound, the next street's flaked to lace. That unevenness is why the deep-dive ends in a camera rather than a conclusion, and why two neighbours with identical houses can honestly need different work.

Read the ranking backwards and it reads as a data summary: 168,163 residents in 74,779 housing units, 42.0% of the housing from before 1960, 36.29 inches of rain in an average year. The pattern leads because the exposure is broad — counted not in individual unlucky houses but in whole eras of the metro's building, stacked one on another.

On a first visit for this pattern, a local plumber's checks run in a practised order:

  • Whether the line has ever been camera-inspected, and what the last footage showed
  • The cleanout's condition — standing water there tells its own story
  • Which fixtures misbehave first, since the ground-floor ones report a main-line problem earliest
  • The age of the street's housing, because neighbouring lines of the same era fail in sequence

From problem to fixed, in Waterloo

A plumbing problem inside a Waterloo homePROBLEM
➔
The same system in Waterloo after professional repairSOLUTION

Areas covered in the Waterloo metro

Waterloo

Population 66,947

Cedar Falls

Population 40,662

Waverly

Population 10,446

Evansdale

Population 4,530

Grundy Center

Population 2,794

Hudson

Population 2,614

Jesup

Population 2,596

Denver

Population 2,216

La Porte City

Population 2,170

Sumner

Population 2,159

Reinbeck

Population 1,805

Dike

Population 1,258

Also in the Waterloo metro: Tripoli (population 1,256), Conrad (population 1,170).

A metro is a federation of building decades wearing one name, and the grid above is Waterloo's federation: Waterloo at the centre, Cedar Falls (40,662 residents) and Waverly (10,446) in the next ring, and the smaller communities beyond, down to places a few thousand households deep. What unites them is one climate record and one routing; what divides them is the year their streets were plumbed. The ZIP list that follows is the practical definition of that federation — if your code is on it, your home's era is part of the data this page was built from.

Beyond the largest communities sit Evansdale (4,530), Grundy Center (2,794), Hudson (2,614), Jesup (2,596), Denver (2,216) — smaller places across Black Hawk, Bremer, Grundy, covered on the same terms. Their housing tends to be older on average than the big suburbs', and their calls follow the older patterns on this page. One routing covers them all: find your ZIP code below and the rest is a phone call.

Waterloo ZIP codes we cover

50609, 50613, 50621, 50622, 50623, 50624, 50626, 50631, 50634, 50638, 50642, 50643, 50647, 50648, 50651, 50657, 50666, 50667, 50668, 50669, 50673, 50674, 50676, 50677, 50680, 50701, 50702, 50703, 50707

The Waterloo metro in detail

Waterloo (66,947 residents) anchors the metro, and Cedar Falls (40,662) is its second centre of gravity. Between them they hold the bulk of the 68,518 households — and, not coincidentally, the bulk of every housing era this page discusses, from the pre-1960 core to the newest subdivisions. Waverly (10,446) and the communities beyond it repeat the same eras at smaller scale.

The metro answers to 3 county governments (Black Hawk, Bremer, Grundy), a patchwork that matters at permit time rather than at the pipe. Black Hawk County carries the centre; the others carry the growth rings and the older outlying towns. A plumber routed through this page works inside that patchwork daily — the water does not care about the boundaries, but the job's paperwork does.

Three neighbouring coverage areas begin where this one ends: Cedar Rapids, IA, some 55 miles off; Iowa City, IA, 84 miles; and Des Moines, IA, 96 miles. Each keeps its own page because each keeps its own numbers — a different median build year, a different climate station, a different problem ranking. Boundary households should trust the ZIP list over the map: the code, not the compass, assigns the dataset.

Set Waterloo among its neighbours and the contrasts sharpen the profile: Cedar Rapids, IA — metro population 279,285, median build year 1976 — sits 55 miles away; Iowa City, IA (182,711, median 1988) 84 miles; Des Moines, IA (758,539, median 1984) 96 miles. Three different housing stocks under three nearby skies, which is why each keeps its own page and its own problem ranking rather than borrowing this one.

Count the metro per unit of itself: 2,579 housing units per covered ZIP code; 22,839 households per county; 14 communities sharing 3 county governments. Then weigh the generations against each other — 4.5 older homes for each newer one — and the service pattern on this page stops being a list and becomes a proportion: that much of the diary written by ageing systems, the rest by young ones wearing in.

One line of Waterloo arithmetic — a median home 60 years old · 47,209 owner-occupied homes against 21,309 renter-occupied · 1,083 pre-1960 homes for every covered ZIP code · a heating-to-cooling degree-day ratio of 7.32 · 922 mm of rain in an average year.

Waterloo plumbing questions

Which neighbourhoods and ZIP codes does PlumbReach USA cover in Waterloo?
Read it off the map below: the coverage is the Waterloo metro entire — 29 ZIP codes through Black Hawk, Bremer, Grundy, taking in Waterloo, Cedar Falls, Waverly, Evansdale and every smaller community in the areas grid. The list is printed in full because coverage questions deserve exact answers: find your code, and you have found whether this page was built for your street. Put the coverage against the Census map and it tracks the population: Waterloo first (39.8% of the metro), then the rings of suburbs and smaller communities in their own building decades — all of it inside the same routing. If a street sits between Waverly and Evansdale, it is in; the list was drawn from the Census map of the metro — 3 counties, 29 codes — rather than from a radius around a shop. The ground inside that boundary holds 74,779 housing units — 31,407 from before 1960, 21,536 from 1960-1979, 11,815 since 2000 — under the climate record kept at WATERLOO MUNI AP, IA US. Stated as the communities it covers: the community ledger reads Waterloo (66,947 residents), Cedar Falls (40,662), Waverly (10,446), Evansdale (4,530) and Grundy Center (2,794), out of 168,163 residents metro-wide.
My Waterloo home was built around 1966. What plumbing should I be watching?
Walk it the way a plumber would. First the visible evidence: staining under sinks, a meter that creeps, drains that have slowed by degrees. Then the era evidence: a home of about 1966 in this metro sits amid 13.4% of housing built between 1980 and 1999 and an older core built earlier still, so mixed pipework — some original, some renewed — is the expectation, and knowing which of yours is which is most of the answer. In Waterloo that plays out across 29 ZIP codes, from Waterloo to Cedar Falls. Geography of the advice: it holds across 29 ZIP codes and 3 counties, in the 68,518 households the Census counts from Waterloo out to Evansdale — the eras differ by district, the watch-list does not. The same applies street by street in Black Hawk County: a median year of 1966 is an average, and the homes on either side of it — older in the core, newer past Evansdale — read from the same materials list. Set against the climate that works on them — 6,714 heating degree days, 918 cooling degree days, 36.29 inches of rain at WATERLOO MUNI AP, IA US — the era of a Waterloo home is the strongest single clue to the condition of its plumbing. Where the watching happens, in figures: the community ledger reads Waterloo (66,947 residents), Cedar Falls (40,662), Waverly (10,446), Evansdale (4,530) and Grundy Center (2,794), out of 168,163 residents metro-wide — one timetable of ageing systems across all of them.
What is the most common plumbing problem in Waterloo?
On this metro's housing and climate numbers, the pattern at the front of the queue is ageing cast iron sewer lines. Cast iron was the standard sewer material for homes built through the middle of the last century, and Waterloo still has a great deal of it underground: 42.0% of homes here were built before 1960 and 70.8% before 1980. It leads this page's problem list for the same reason — the sections above rank every pattern by the data behind it, with the signs that tell a watch-and-wait issue from one to act on today. The backdrop is the same metro-wide: 74,779 housing units working against the WATERLOO MUNI AP, IA US climate record. For scale, the runner-up is galvanized pipes at the end of their life, and the gap between them is the metro's own arithmetic: housing counted across Black Hawk, Bremer, Grundy, weather logged at WATERLOO MUNI AP, IA US, and an era profile with a median of 1966. Change one input and the order moves: at WATERLOO MUNI AP, IA US the record reads 6,714 heating degree days against 918 cooling; in the stock, 42.0% predates 1960 and 70.8% predates 1980. The inputs behind the ranking, community by community: the community ledger reads Waterloo (66,947 residents), Cedar Falls (40,662), Waverly (10,446), Evansdale (4,530) and Grundy Center (2,794), out of 168,163 residents metro-wide.
Does Waterloo's weather affect my plumbing?
Put a single number on it: the average year at WATERLOO MUNI AP, IA US runs to about 49.0 degrees, but a plumbing system never meets the average — it meets the extremes the average is built from. 15.3 hot days drive the heater and drain load; 150.5 freezing nights test the exposed lines. A Waterloo home's pipes live at both ends of that spread, every year, for as long as the house stands. The figures behind that answer, from the station record: a yearly average of 49.0 degrees, 36.29 inches of precipitation, 15.3 days at 90 or above and 150.5 nights at freezing or below — the four numbers this page's seasonal section is built from. It is the same story from Cedar Falls to Waverly — the stock decides, and this stock's median build year is 1966. The record behind it is measured at WATERLOO MUNI AP, IA US and felt from Cedar Falls to Evansdale: one climate for Black Hawk, Bremer, Grundy, 74,779 housing units, and every pipe, heater and lateral inside them. The figures are worth keeping with the house papers: 49.0 degrees as the yearly average at WATERLOO MUNI AP, IA US, 36.29 inches of precipitation, and a housing stock whose median year is 1966 — the three numbers this metro's plumbing lives by. The numbers in one line: 49.0 degrees average, 36.29 inches of precipitation, 6,714 heating degree days, 918 cooling degree days, 15.3 days at 90 or above, 150.5 nights at freezing or below. Whose roofs that weather works on: the community ledger reads Waterloo (66,947 residents), Cedar Falls (40,662), Waverly (10,446), Evansdale (4,530) and Grundy Center (2,794), out of 168,163 residents metro-wide.
A pipe just burst at my Waterloo house — what are the first three things to do?
The first five minutes belong to one valve. Find the main shutoff (meter box at the street for many Waterloo homes, an interior valve for others), close it, then open a low faucet so the broken line empties into a drain instead of a wall. Photograph the damage for your records once the water stops, keep clear of any electrics the water has reached, and then call — in that order. Across the metro's 3 counties, Black Hawk County included, the pattern repeats wherever the housing matches. One metro, two shutoff geographies: the pre-1980 districts around the centre and out in Cedar Falls run interior valves, while the slab subdivisions through Waverly run meter boxes at the street. The 68,518 households in Black Hawk, Bremer, Grundy divide between them, and the calm-day version of this emergency is learning which one your home has. The calm-day homework for this metro: walk the 29 covered ZIP codes' worth of housing in your mind to your own valve — in Black Hawk County the older stock hides it indoors, the slab tracts past Waverly at the meter — and turn it once before you ever need it in anger. The calm-day version, localised: find your valve before WATERLOO MUNI AP, IA US's next freeze season — 150.5 freezing nights a year — whether your home sits near Waterloo, out in Cedar Falls (40,662 residents) or past Waverly (10,446). True across the whole stock: the era ledger reads 31,407 homes before 1960, 21,536 from 1960-1979, 10,020 from 1980-1999 and 11,815 since 2000 — 74,779 units, 68,518 households, 68.9% of them owner-occupied — the valve's address changes with the era, the first move does not. The ranking that frames the damage: Ageing cast iron sewer lines first on this page, galvanized pipes at the end of their life second, freeze-burst pipes in cold snaps third — the burst line in front of you belongs to the same local arithmetic. Learn it street by street if you must: the 50707 subdivisions shut off at the meter, the 50674 districts at the wall, the oldest homes out toward 50621 at a curb stop — the map of valves is the map of build decades.
Are older Waterloo homes more likely to need repiping?
Sometimes, and the distinction is mechanical. Repairs replace a section; repiping replaces a material — and it is the material, not the section, that is failing when leaks multiply in an older Waterloo home. Galvanized lines from the metro's pre-1980 stock (70.8% of all homes) are the usual defendant. A plumber who recommends a fourth repair on that pattern without naming the alternative is not doing you a favour. Homeowners in Cedar Falls (40,662) and Waverly (10,446) read this page for the same reason — the stock there is the same stock. Drive it in any direction — out to Evansdale, back through Cedar Falls — and the eras change but the materials story does not. Ask where this conversation happens most and the answer is a map: the districts plumbed in the galvanized decades, from the centre out through Cedar Falls (40,662 residents) and Waverly (10,446), across Black Hawk, Bremer, Grundy. The newer communities in the grid hear it rarely — their turn is scheduled decades from now. Streets matter to the timing: the founding districts near Waterloo reach the pattern first, the post-war ring through Cedar Falls and Waverly a decade behind, the subdivisions past Evansdale a generation behind that. Streets carry the same ledger at household scale: from Waterloo (66,947 residents) through Cedar Falls (40,662) to Waverly (10,446), the leak sequence means the same thing wherever the material matches. Where the conversations happen: the community ledger reads Waterloo (66,947 residents), Cedar Falls (40,662), Waverly (10,446), Evansdale (4,530) and Grundy Center (2,794), out of 168,163 residents metro-wide, earliest and oftenest in the founding names on that list.
What exactly does PlumbReach USA do in Waterloo, if it does not do the plumbing?
Two things, and only two. We publish the homework — city pages like this one, built from Waterloo's Census and climate records — and we route calls to independent local plumbing professionals. We do not employ those professionals, set their schedules, or carry out the work in your home. If that distinction ever seems blurred on a page of ours, the plainer reading is the right one. The local figures behind it: 52,944 homes from before 1980 and 11,815 built since 2000, sharing one system of streets and soil. From Cedar Falls to Evansdale, the model does not change: PlumbReach USA publishes the homework — this page, built from Waterloo's Census and NOAA records — and routes the call; the independent professional who serves that part of Black Hawk, Bremer, Grundy does everything at the home. It is worth being precise about the local end of the arrangement: the professional serving Cedar Falls or Evansdale sets their own terms with you, carries their own responsibility for the work, and answers for it — our routing is the only part this page undertakes. Nothing about the arrangement changes with the data on this page: WATERLOO MUNI AP, IA US's record, a median build year of 1966, 52,944 pre-1980 homes — the homework is ours, the work is the local professional's, in every district alike. The arrangement holds in every community: the community ledger reads Waterloo (66,947 residents), Cedar Falls (40,662), Waverly (10,446), Evansdale (4,530) and Grundy Center (2,794), out of 168,163 residents metro-wide.
What plumbing checks are worth doing each year in Waterloo?
One page of a notebook, kept yearly. On it: the shutoff, turned and confirmed. The heater, drained and its age noted against the plate. The meter, read twice on a quiet evening. The cleanout, glanced down. The ground-floor drains, run full for a minute each. In Waterloo — median build year 1966, 15.3 hot days, 150.5 freezing nights — that single page, repeated annually, is the difference between meeting your plumbing on your schedule and meeting it on its. None of it is abstract at this scale: 68,518 households across Black Hawk, Bremer, Grundy share one climate and one ageing stock, so a yearly rhythm kept by even a fraction of them is the difference between this metro's plumbing failing in private, one house at a time, and failing on a schedule somebody saw coming. The checks travel well because the conditions do: WATERLOO MUNI AP, IA US's record covers Cedar Falls, Waverly and Evansdale alike, and the housing eras repeat across all 29 ZIP codes. A neighbour in another district keeping the same calendar is not copying you; they are reading the same data. The calendar's local proof is in the stock figures: 52,944 pre-1980 homes to keep valves alive in, 11,815 post-2000 homes reaching first-fixture age together, and 36.29 inches of rain a year testing every cleanout in Black Hawk, Bremer, Grundy. The checks are sized to the stock's actual eras — a median build year of 1966, 42.0% of it pre-1960 — not to a generic house that exists nowhere in Waterloo. The routine's territory, in codes: the codes run 50609, 50638, 50669, 50707 and 50674 among the 29 on the list, spread over Black Hawk, Bremer, Grundy.
Who decided that these are Waterloo's main plumbing problems?
Nobody picked them by hand. The ranking is the output of this page's two datasets — Census housing figures for the Waterloo metro and NOAA climate normals for WATERLOO MUNI AP, IA US — run through the same scoring every metro gets. That is why the list here leads where it leads, and why a metro built in different decades under a different sky gets a different list: the method is shared, the numbers are not. Run the same scoring on any single district and the order bends: Cedar Falls's streets would rank their own list, Evansdale's another. This page ranks the metro as a whole — 68,518 households across Black Hawk, Bremer, Grundy — which is why the evidence paragraphs keep returning to where each pattern actually concentrates. A useful check on the method: run it on Cedar Falls alone and the order bends toward that district's eras; run it on the whole metro — 68,518 households — and you get the list printed here. The evidence trail is on this page: the problem sections scored pattern by pattern, the housing profile drawn from Black Hawk, Bremer, Grundy, the climate read from WATERLOO MUNI AP, IA US — the ranking is the two records read together, nothing else. The scoring's raw material, code by code: the codes run 50609, 50638, 50669, 50707 and 50674 among the 29 on the list, spread over Black Hawk, Bremer, Grundy. The dataset's own label for the unit being scored: the Waterloo–Cedar Falls metro — 168,163 residents, 68.9% of them owner-occupiers — scored whole, because its housing and its weather arrive whole. Subset the inputs and the order bends: score Cedar Falls's streets alone and their eras lead; score the Evansdale subdivisions alone and theirs do. The printed order belongs to the full 29-code metro, no smaller unit.
Where are Waterloo's oldest homes, and why does it matter for plumbing?
Ask a plumber who has worked this metro for years and the answer comes as a drive, not a list: start at the old centre of Waterloo, where the houses went up before modern materials existed, and every street outward is a decade younger in its pipework. The pattern is reliable enough to stock a van by — iron and clay near the middle, steel in the post-war ring, copper and plastic beyond — and it is why the oldest homes are not scattered through Waterloo but layered, in the order the metro grew. It is also a numbers story: of Waterloo's 74,779 housing units, the pre-1960 share is 42.0% — the largest single concentration of original-era pipework in the metro, sitting in the districts where Black Hawk County's streets were laid out first. Concentrations, for the record: the oldest systems sit inside the 31,407 pre-1960 homes, and those homes cluster — the founding core, the streetcar-era streets, the first suburbs in Black Hawk County — rather than scattering evenly across the 29 covered ZIP codes. County lines annotate the same map: the old core sits in Black Hawk County, and the rings cross into the rest of Black Hawk, Bremer, Grundy as they widen — the pipework's age follows the building, not the boundary. It is a population map as much as a plumbing map: 168,163 residents, 68,518 households, and the oldest pipework concentrated where the earliest of them settled — the founding districts of Black Hawk County. The oldest systems' addresses, in codes: the codes run 50609, 50638, 50669, 50707 and 50674 among the 29 on the list, spread over Black Hawk, Bremer, Grundy, with the oldest plumbing toward the first codes on the list. Counted under its Census name — the Waterloo–Cedar Falls metro, 168,163 residents, 68.9% owner-occupied — the oldest layer is a defined population of homes, not a figure of speech.
If a plumber assessed my Waterloo home tomorrow, what would they look at first?
Expect the flags this metro's figures predict. In Waterloo the recurring findings are shutoffs seized from disuse, heaters past their anode's protection, supply lines in original the 1960s material, and a meter that creeps when the house is quiet. The check hunts those four in that order, then reads whatever the house adds of its own — in a stock of 74,779 homes, no two inspections are identical, but the shortlist rhymes from street to street. The metro's figures say why the order matters here: 52,944 pre-1980 homes means shutoffs and heaters of a certain age are the statistical norm rather than the exception, and a climate of 6,714 heating degree days works every heater in Black Hawk County hard enough to justify its place near the front of the walk. The walk's findings repeat across the footprint with local accents: seized shutoffs in Cedar Falls's older streets, heater sediment in the growth subdivisions past Waverly, meter creep in the slab tracts toward Evansdale — one shortlist, read against 74,779 homes under WATERLOO MUNI AP, IA US's sky. Keep the findings with the house records: in a metro of 68,518 households, the homes whose owners can date their last check are the ones whose failures arrive as appointments — the entire point of the half hour. District accents, with figures: Cedar Falls (40,662 residents) leans to valves and materials, Waverly (10,446) to heaters and drains, Evansdale to first-generation fixtures — one walk, three readings. The walk's districts, named: the community ledger reads Waterloo (66,947 residents), Cedar Falls (40,662), Waverly (10,446), Evansdale (4,530) and Grundy Center (2,794), out of 168,163 residents metro-wide.

Before an emergency, read the guide: How to shut off your home's water main

Nearby metro areas

One call to a Waterloo plumber

PlumbReach USA routes your call to an independent local plumbing professional serving Waterloo — the assessment and the work are theirs.

Call center hours: Mon-Fri 7:00 AM-10:00 PM ET | Sat 8:00 AM-10:00 PM ET | Sun 7:00 AM-9:00 PM ET

Call Now
