

Home / Cities / Missouri / St. Louis

Plumbing Services in St. Louis, MO

Everything on this page was computed for St. Louis and nowhere else: the problem ranking from its Census housing profile, the seasonal risks from its NOAA station record, the coverage from its own ZIP codes. PlumbReach USA connects you to an independent local plumber; the page itself is the homework, done in public, so the call you make is an informed one.

Call center hours: Mon-Fri 7:00 AM-10:00 PM ET | Sat 8:00 AM-10:00 PM ET | Sun 7:00 AM-9:00 PM ET

241
ZIP codes covered
15
Counties in the metro
1,154,841
Households (Census ACS)
1973
Median year home built
St. Louis, MO — the metro skyline and landscape
St. Louis, MO — plumbing help across the metro
A local plumber's van on a residential street
Local plumbers serving St. Louis neighbourhoods
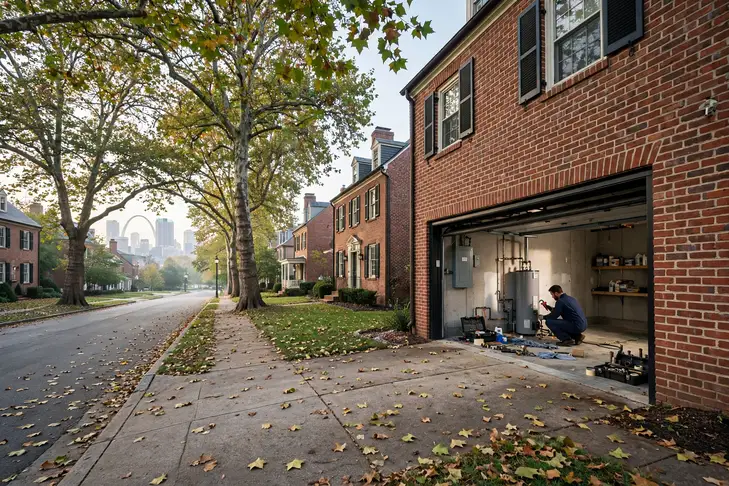
Water heater installation in a home garage
Water heater work across the metro

St. Louis plumbing, in brief

The median St. Louis home was built in 1973; 58.8% of the stock predates 1980, and the pattern this metro's own data ranks first is ageing cast iron sewer lines. PlumbReach USA is a referral service, not a plumbing company: one call connects you with an independent local plumber serving your ZIP code.

The St. Louis housing stock, and what it means for plumbing

The stock, in one pass: 2,809,414 residents, 1,267,353 housing units, 1,154,841 households — and a build history that splits the metro into plumbers' generations. 33.8% of homes stand from before 1960; 58.8% from before 1980; the rest divide between the late-century suburbs and the 18.5% built since 2000. Every era is a materials decision still in force: the pipes in a St. Louis wall are the ones its decade specified, ageing on that decade's schedule, whatever the current owner's plans for them.

The pre-1980 districts are not a museum; they are most of the metro's working housing, and their plumbing is a patchwork in the literal sense — original runs beside renewed sections, a heater of one decade feeding fixtures of another. Across 745,204 such homes in Bond, Calhoun, Clinton, Jersey, Macoupin, Madison, Monroe, St. Clair, Franklin, Jefferson, Lincoln, St. Charles, St. Louis, Warren, St. Louis city, no two systems share exactly the same repair history, which is why the guidance below insists on pattern over incident: in patchwork plumbing, what has already been replaced is as diagnostic as what has failed.

Uniformity is the newer stock's defining trait. A subdivision in O'Fallon or St. Charles went up in a handful of years, fitted with one generation of fixtures, one heater model class, one approach to running lines under slabs. That uniformity writes a calendar the whole street shares: the first heater wave, the first cartridge wave, the first questions about lines under concrete arrive together, years before the same streets need anything structural. With 18.5% of the metro built since 2000, that calendar governs a large and growing share of St. Louis's plumbing work — predictable work, if a household reads the calendar early.

Over everything sits the weather, and here it is measured rather than described: NOAA's station at ST LOUIS LAMBERT INTL AP, MO US averages 57.4 degrees across the year, with 47.1 days reaching 90 or more and 84.9 nights at freezing or below. A buried lateral feels that record as soil that swells and pulls away; a water heater feels it as an unbroken cycle count; an exposed line feels it on the single coldest night. The problem ranking below is what those numbers, crossed with the housing profile, produce for St. Louis specifically.

The St. Louis plumbing profile in numbers

Housing eras and climate, joined — the two datasets every section of this page is built from.

Break the stock down by building era and the profile sharpens. Before 1960: 33.8% of homes, roughly 428,365 of them. From 1960 to 1979: 25.0%, about 316,838. From 1980 to 1999: 22.7%, about 287,689. Since 2000: 18.5%, about 234,460. Four eras, four material palettes — and the balance among them is this metro's plumbing character in a single paragraph.

Some metros are defined by their growth; this one is defined by its inheritance. The largest share of St. Louis's homes was built before 1960, and inheritance in plumbing means materials at the end of their design lives serving households who did not choose them. The work that follows from that fact is the metro's staple: drains renewed, supplies renewed, laterals renewed — the patient, house-by-house replacement of a founding stock. Newer districts exist and matter, but they are not where this metro's plumbing character was decided.

The second band in the table is the 1960-1979 stock: 316,838 homes, 25.0% of the metro. It is the transition generation — copper arriving, galvanized lingering, drains mixed street by street — and it supplies St. Louis with its most diagnostic plumbing: two homes of the same year needing opposite answers, decided by what the builder happened to specify.

No profile of this metro is complete without its extremes, because plumbing meets the extremes, not the averages. The average year at ST LOUIS LAMBERT INTL AP, MO US — 57.4 degrees, 41.7 inches of precipitation — is a statistical resident of a metro nobody lives in. The lived version is the coldest night of January against an uninsulated run, the storm week that saturates the soil over every lateral, the August stretch that works heaters and drains without a pause. The numbers in this section are the averages; the problems ranked below are the extremes, translated.

That is the whole method of this page in one section: era shares from the Census, loads from NOAA, and a problem list that is simply where the two overlap most in St. Louis. The services and guidance that follow are ordered by the same profile — local first, generic last.

Plumbing problems St. Louis homes actually get

Selected and ranked from this metro's housing-age profile and climate record — not copied from another city's page.

Ageing cast iron sewer lines

Cast iron was the standard sewer material for homes built through the middle of the last century, and St. Louis still has a great deal of it underground: 33.8% of homes here were built before 1960 and 58.8% before 1980. Cast iron does not fail all at once. It corrodes from the inside out, the bottom of the pipe thinning and scaling until waste catches on the rough surface, and a line that drained freely for decades starts slowing, then backing up. By the time roots find the joints of an old cast iron line, the pipe wall around them is often too thin for cleaning alone to be the whole answer. A camera inspection shows exactly how much good pipe is left: scaling near the top of the line may clean up well, while a channel rotted along the bottom means that section is living on borrowed time. Homeowners in St. Louis with a pre-1960 house and drains that misbehave through the whole home — not just one fixture — are usually looking at this story, and the sensible first step is a camera look before another cleaning is booked.

Look inside an old cast iron line with a camera and the failure stops being abstract. The inner wall grows rough with tuberculation — rust nodules that narrow the bore and catch everything passing. The bottom of the run, where water and grit travel, thins fastest; the top can look sound while the channel below it is nearly through. Roots enter at joints and add their own blockage. A St. Louis line of this vintage is therefore not one problem but a profile of problems along its length, and the repair that makes sense — cleaning, a section, a full replacement — is the one matched to the worst ten feet the camera finds, not the average of the whole run.

The historical record is the evidence: iron was the default drain material for the whole era that built this metro's core, and the Census counts that era's survivors home by home — 428,365 of them. Camera surveys in those districts confirm the arithmetic often enough that the pattern's ranking here is the least speculative thing on this page.

Watch for

  • Whole-house slow drains in a home built before 1960
  • Backups that return within months of a cleaning
  • Sewer odour near the yard or a soggy strip of lawn

About sewer line repair & replacement ➔

Galvanized pipes at the end of their life

Run two taps at once in a galvanized house and the second one apologises. That is the material's signature in old age: rust accreting inside the bore until the pipe delivers a fraction of its designed flow, weakest at the far end of the run. St. Louis carries 745,204 pre-1980 homes, and the ones still on original galvanized announce themselves the same way — pressure that fades year by year, water that runs tea-coloured after a quiet weekend. Repiping is simply the moment the household stops negotiating with the symptom and replaces the cause.

The geography of galvanized failure inside one house is uneven, and the unevenness misleads people. The runs nearest the water heater corrode fastest, worked by heat; long horizontal runs narrow differently from vertical risers; the line to a little-used guest bathroom may be nearly closed while the kitchen still flows. This is why a St. Louis home can seem fine at most taps while one shower has given up entirely. Repiping answers the whole geography at once, which is its real argument: not that any single run has failed, but that the system's remaining life is scattered unevenly through every wall, and spot repairs keep buying the shortest-lived section.

Count the exposure from the Census side: the metro's 745,204 pre-1980 homes were plumbed in galvanized's long reign, and the material's failure mode — internal rust, narrowing bore — is a matter of chemistry, not workmanship. The variable is speed; the direction, for every one of those systems still original, is settled.

Watch for

  • Fixtures farthest from the meter noticeably weaker than near ones
  • Rust-coloured first water of the day that clears within seconds
  • Shower pressure that drops hard when a second tap opens

About pipe repair & repiping ➔

Freeze-burst pipes in cold snaps

Water expands as it freezes, and a pipe gives it nowhere to go. The split rarely announces itself in the cold — it waits for the thaw, when pressure returns and the crack opens into a spray inside a wall, a ceiling or a crawl space. The lines that go are predictable: runs through exterior walls, garages, crawl spaces and any stretch the heating never reaches, in homes plumbed before routing pipes through conditioned space became the habit. One hard night is enough; the damage is done by the thaw, and it is usually discovered by the sound of running water in a quiet house or a stain spreading across a ceiling that was dry at breakfast.

Prevention, for this pattern, is a geography lesson: the burst never happens in the middle of the heated house. It happens at the perimeter — the wall cavity on the windward side, the run beneath the addition, the pipe the builder routed through the garage to spare six feet of copper. In St. Louis, where 47.1 summer days tempt everyone to forget what 84.9 freezing nights intend, the autumn ritual is short and specific: find every line that leaves the warmth, and do something about it. The households that keep that ritual read about burst pipes the way other people do — as news.

Local exposure, stated plainly: a large stock of homes plumbed before freeze protection was designed-in, standing in a climate that freezes on 84.9 nights a year. Either figure alone is unremarkable; together they describe a metro where burst lines are a seasonal category of call, not an anomaly.

Watch for

  • A pipe that froze during a cold snap, even if it did not burst
  • Water stains appearing as temperatures rise after a freeze
  • Exposed lines in garages, crawl spaces or outside walls

About pipe repair & repiping ➔

Ageing sewer laterals

One pipe carries everything a house produces, and in the older half of this metro that pipe has been buried since the street was young. Clay sections shift as soil settles; cast iron scales inward; joints open by degrees. The lateral rarely fails all at once — it degrades into symptoms the household learns to live with: the slow drain blamed on the fixture, the gurgle blamed on venting, the cleanings that help for shorter and shorter stretches. Each of those is the lateral reporting its condition. When sewage finally backs up into the ground-floor tub, the line has usually been compromised for a long while, and the question the camera answers is how much of it: a section, or the whole run from house to main.

A lateral gives decades of silence and then a short conversation. The conversation usually starts with the ground-floor drain in the house and escalates through the cleanout to the camera — and the camera's footage settles every argument about whether the line is blocked or broken. Across St. Louis, the laterals entering that conversation now are the ones buried when the metro's median home went up, in 1973. They were built to outlast their mortgages, and they have; the question the footage answers is how much further the same pipe can honestly be asked to go.

Universality is the point: every housing unit in the metro — 1,267,353 of them — drains through one lateral apiece, and the older half of that stock is served by lines as old as the homes above them. A component that universal, ageing on that schedule, does not need bad luck to top a problem list; it needs only time.

Watch for

  • More than one ground-floor fixture draining slowly at the same time
  • A cleanout in the yard holding standing water when opened
  • Wet, sunken or unusually lush ground along the line's run to the street

About sewer line repair & replacement ➔

Tree roots in sewer joints

A root system is patient and it is thirsty. It finds the joints in a buried drain line — the small gaps where sections meet, exhaling moisture vapour — and sends in hair-fine roots that thicken on the water and the nutrients the line carries past them. Year by year the mass grows until it is a net across the pipe, catching paper and grease, slowing the flow, gurgling its warning through the ground-floor fixtures. Mature streets grow mature trees, and the drains beneath them were jointed by hand; the two facts together write this metro's share of the problem. Cutting the roots restores the line for a season or several; a joint the roots have forced open is a repair, and the camera tells one from the other.

Not every tree is an equal suspect. Fast-growing species with wide, water-hungry root systems explore the most ground, and a tree planted decades ago over a jointed line has been prospecting along it ever since — root tips follow moisture gradients measured in fractions, straight to the joint that breathes vapour. The mass a camera finds is therefore usually at a joint directly in a root run's path, which is why clearing the roots without addressing the joint is a postponement: the path stays open, the roots regrow along it, and the cycle shortens each time. Sealing or replacing the jointed section is what breaks the rhythm for good.

Time is the ingredient, and St. Louis has supplied it: the metro's older districts pair jointed drain lines from the 1970s and earlier with street trees planted the same decades. A root system has had forty, fifty, sixty years to explore the joints under those streets. Where the housing is newer and the pipe is plastic with fused joints, the invitation never arrives — which is why this problem maps so precisely onto the old-tree, old-pipe neighbourhoods.

Watch for

  • Backups that return on a seasonal rhythm, worst in the growing months
  • A gurgling toilet on the ground floor after the upper bathrooms drain
  • Fine root hairs visible in what a clearing pulled from the line

About sewer line repair & replacement ➔

Winter pipe season in St. Louis

This is the season the metro's housing stock is examined by the weather, and the examination is practical: every exposed run, every unheated void, every shutoff nobody has tested. The failures arrive in batches behind the hardest nights and announce themselves at the thaw. The rest of the season grades the slower systems too — heaters working against the coldest incoming water of the year, laterals under frozen ground — but the headline the season writes, year after year, is the sound of water in a wall that should be dry.

Put the season in figures: 84.9 freezing nights a year at ST LOUIS LAMBERT INTL AP, MO US, against a median build year of 1973. Half of St. Louis's homes are that old or older, and their exposed lines sit the winter's examination every year — the failures the season produces are simply the papers it fails.

A closer look: ageing cast iron sewer lines in St. Louis

There is a reason this pattern tops so many old-metro lists, and St. Louis holds the reason in bulk: iron was simply what drains were, for the whole first age of indoor plumbing. Every pre-1960 home still on its original line — and the Census counts 428,365 pre-1960 homes here — is running an experiment in how long buried iron can serve. The results arrive unevenly: one street's lines camera clean and sound, the next street's flaked to lace. That unevenness is why the deep-dive ends in a camera rather than a conclusion, and why two neighbours with identical houses can honestly need different work.

Why here and not everywhere: St. Louis pairs 745,204 pre-1980 homes with 47.1 days a year at 90 degrees or more and 84.9 nights below freezing. Every metro pairs its housing with its weather somehow; this particular pairing is what puts the pattern where it sits on this page's list, ahead of problems that dominate metros built in other decades, under other skies.

On a first visit for this pattern, a local plumber's checks run in a practised order:

  • The ground-floor fixtures first — a main-line problem reports there before anywhere else
  • The age and material of the line, from the home's era and any past camera reports
  • Whether gurgling tracks the washing machine's discharge — a classic main-line signature
  • The cleanout's cap and condition, and whether it has ever been opened

Plumbing services in St. Louis

Sequenced by this metro's own problem ranking, not by a national catalogue order.

Sewer Line Repair & Replacement in St. Louis

Roots, offsets, bellies, corrosion — the camera distinguishes them, and each has a different remedy at a different scale. That is the whole logic of sewer work: see the line first, then decide whether it needs a clearing, a section, or a new run entirely.

The case for camera-first sewer work is written in this metro's building history. St. Louis's laterals run in clay, iron, early plastic and modern plastic depending on the decade of the street — four materials with four failure styles and four different correct repairs. Treating them as one material invites the classic error: clearing a collapsed clay line as though it were a blocked plastic one, and booking the household for a repeat performance. The survey removes the guesswork at the start, when it is cheapest to remove, and every recommendation that follows can point to footage rather than opinion. Ask in St. Peters and the answer rhymes with St. Louis: same eras, same materials, same calendar of failures.

Under St. Louis lie 1,267,353 laterals, one per housing unit, and the oldest of them — beneath the 428,365 pre-1960 homes — have been underground since the metro was a fraction of its present size. The camera diary in O'Fallon and the old core is written by that buried generation.

Where this service gets booked in St. Louis follows the map on this page: the older districts generate the deep-end work, the post-2000 subdivisions the wear-and-tear work, and the 287,689 homes in between split the difference. Telling the call center your home's build decade — most St. Louis owners know it within a few years — puts the right kit on the van the first time.

More about sewer line repair & replacement ➔

Pipe Repair & Repiping in St. Louis

Pipes age by material: galvanized chokes with rust, copper pits into pinholes, early plastic turns brittle. Repair answers the isolated failure; repiping replaces a system whose failures have become a rhythm, rerunning supply lines in modern material while the house stays liveable around the work.

The repiping conversation in St. Louis starts with its housing data: median build year 1973, 58.8% of homes from before 1980, and whole districts plumbed in materials that are now at or past their expected service lives. Galvanized lines in the older neighbourhoods have been narrowing from the inside for decades; the symptom homeowners notice — pressure fading year by year — is the pipe's inner diameter closing. One pinhole in that stock is an event; the third is a pattern, and the plumbers who work St. Louis and the older core will say so plainly rather than sell a fourth repair. Count it in homes if you prefer: 745,204 built before 1980, 234,460 since 2000, one shared system of soil and seasons.

Pipe work divides by era in this metro with unusual neatness: renewal conversations in the 745,204 pre-1980 homes, sectional repairs in the middle ring, and near-silence from the 234,460 post-2000 homes whose lines are still young. A call from St. Peters can sit in any of the three bands; the home's build year says which before the door opens.

One local habit worth copying: St. Louis homeowners who mention their street's building era when they book get a better-matched visit, because a plumber heading to a the 1970s home in Bond County loads different parts than one heading to a slab-built subdivision in O'Fallon. The service is the same; the preparation is local.

More about pipe repair & repiping ➔

Emergency Plumbing in St. Louis

In St. Louis the emergency call is routed, not queued: one number reaches the independent local plumber covering Bond, Calhoun, Clinton, Jersey, Macoupin, Madison, Monroe, St. Clair, Franklin, Jefferson, Lincoln, St. Charles, St. Louis, Warren, St. Louis city at that hour, and the housing record on this page — median build year 1973 — is the homework they arrive already knowing.

More about emergency plumbing ➔

Drain Cleaning in St. Louis

Drain work in St. Louis splits by era: the 745,204 pre-1980 homes drain through older materials, the post-2000 subdivisions through plastic — and the local plumber reads the cable's return to tell which world your street drains through.

More about drain cleaning ➔

Water Heater Repair & Installation in St. Louis

From St. Louis to St. Peters, the heater question is the same — repair the unit or renew it — and the honest answer starts from its age against St. Louis's demand record, which this page sets out.

More about water heater repair & installation ➔

Leak Detection & Repair in St. Louis

The meter test starts it in St. Louis as everywhere; what follows is local — knowing which of Bond, Calhoun, Clinton, Jersey, Macoupin, Madison, Monroe, St. Clair, Franklin, Jefferson, Lincoln, St. Charles, St. Louis, Warren, St. Louis city' eras hide lines in slabs, which in crawl spaces, and where the soil movement at ST LOUIS LAMBERT INTL AP, MO US's record makes joints let go.

More about leak detection & repair ➔

Toilet Repair & Installation in St. Louis

In St. Louis, a toilet that runs all night is a water bill with a sound; the local service replaces the tired internals and checks the flange and supply while the tank is open.

More about toilet repair & installation ➔

Faucet, Fixture & Garbage Disposal Repair in St. Louis

In St. Louis the faucet call is often the first plumbing visit a newer home ever gets — the professionals routed here treat it as an introduction: the fixture fixed, and the home's shutoffs and heater age noted for the record.

More about faucet, fixture & garbage disposal repair ➔

What St. Louis books most

Ask where this metro's plumbing diary fills up and the answer is a short story: Ageing cast iron sewer lines first, galvanized pipes at the end of their life close behind, and the services that answer them doing the bulk of the booked work. Everything else on the list above is the supporting cast — necessary, frequent enough, but not what St. Louis's housing stock, at its age and in its climate, principally demands. Read the service list as a weather report for the metro's pipes and it stops looking like a catalogue.

From problem to fixed, in St. Louis

A plumbing problem inside a St. Louis homePROBLEM
➔
The same system in St. Louis after professional repairSOLUTION

Areas covered in the St. Louis metro

St. Louis

Population 293,109

O'Fallon

Population 92,697

St. Charles

Population 71,048

St. Peters

Population 58,200

Florissant

Population 51,915

Chesterfield

Population 49,591

Wentzville

Population 45,734

Belleville

Population 41,722

Wildwood

Population 35,168

Oakville

Population 35,166

University City

Population 34,655

Ballwin

Population 30,835

Also in the St. Louis metro: Kirkwood (population 29,302), Mehlville (population 29,089).

Beyond St. Louis itself, the metro takes in O'Fallon (92,697 residents), St. Charles (71,048) and the rest of the communities in the grid above — each plumbed in its own building era, which is why two streets in the same metro can need entirely different plumbing conversations. The ZIP list below is the full coverage footprint: if your code is on it, this page was written about your housing stock.

The map continues: St. Peters (58,200), Florissant (51,915), Chesterfield (49,591), Wentzville (45,734), Belleville (41,722). Different names, different decades — each community in Bond, Calhoun, Clinton, Jersey, Macoupin, Madison, Monroe, St. Clair, Franklin, Jefferson, Lincoln, St. Charles, St. Louis, Warren, St. Louis city was plumbed in its own growth years, which is why two streets in the same metro can need entirely different plumbing conversations. The ZIP list below is the working definition of coverage; the housing behind each code is the working definition of the job.

St. Louis ZIP codes we cover

62001, 62002, 62006, 62009, 62010, 62012, 62013, 62014, 62018, 62019, 62021, 62022, 62023, 62024, 62025, 62026, 62028, 62030, 62031, 62033, 62034, 62035, 62036, 62037, 62040, 62045, 62046, 62047, 62048, 62052, 62053, 62058, 62059, 62060, 62061, 62062, 62063, 62067, 62069, 62074, 62079, 62084, 62085, 62086, 62087, 62088, 62090, 62093, 62095, 62097, 62201, 62203, 62204, 62205, 62206, 62207, 62208, 62215, 62216, 62218, 62219, 62220, 62221, 62223, 62225, 62226, 62230, 62231, 62232, 62234, 62236, 62239, 62240, 62243, 62244, 62245, 62246, 62248, 62249, 62250, 62253, 62254, 62255, 62256, 62257, 62258, 62260, 62262, 62264, 62265, 62266, 62269, 62273, 62275, 62278, 62279, 62281, 62282, 62284, 62285, 62289, 62293, 62294, 62295, 62298, 62626, 62630, 62640, 62649, 62667, 62672, 62674, 62685, 62690, 63005, 63010, 63011, 63012, 63013, 63014, 63015, 63016, 63017, 63019, 63020, 63021, 63023, 63025, 63026, 63028, 63031, 63033, 63034, 63037, 63038, 63039, 63040, 63041, 63042, 63043, 63044, 63045, 63047, 63048, 63049, 63050, 63051, 63052, 63053, 63055, 63056, 63060, 63061, 63068, 63069, 63070, 63072, 63073, 63074, 63077, 63079, 63080, 63084, 63088, 63089, 63090, 63101, 63102, 63103, 63104, 63105, 63106, 63107, 63108, 63109, 63110, 63111, 63112, 63113, 63114, 63115, 63116, 63117, 63118, 63119, 63120, 63121, 63122, 63123, 63124, 63125, 63126, 63127, 63128, 63129, 63130, 63131, 63132, 63133, 63134, 63135, 63136, 63137, 63138, 63139, 63140, 63141, 63143, 63144, 63146, 63147, 63155, 63301, 63303, 63304, 63332, 63341, 63343, 63347, 63348, 63349, 63351, 63357, 63362, 63365, 63366, 63367, 63368, 63369, 63373, 63376, 63377, 63379, 63380, 63381, 63383, 63385, 63386, 63387, 63389, 63390

The St. Louis metro in detail

The metro's weight is not evenly spread. St. Louis holds 293,109 of the 2,809,414 residents; O'Fallon and St. Charles add 92,697 and 71,048; and the remainder scatters across the smaller places above, some no bigger than a few thousand people. Plumbing follows the weight — most calls come from where most homes are — but era matters more than size: a small community of 1960s housing generates older-system work than a large new subdivision does.

Administratively the metro is drawn from Bond, Calhoun, Clinton, Jersey, Macoupin, Madison, Monroe, St. Clair, Franklin, Jefferson, Lincoln, St. Charles, St. Louis, Warren, St. Louis city — 15 in all — with Bond County at its centre. County lines do not change pipe physics, but they do shape the paperwork around the work: permits, inspections and code details are county and city business, which is one reason the professional who serves your street is a local one.

Three neighbouring coverage areas begin where this one ends: Jefferson City, MO, some 99 miles off; Columbia, MO, 124 miles; and Springfield, MO, 182 miles. Each keeps its own page because each keeps its own numbers — a different median build year, a different climate station, a different problem ranking. Boundary households should trust the ZIP list over the map: the code, not the compass, assigns the dataset.

The region around St. Louis is a set of variations on its theme: Jefferson City, MO, 99 miles off, runs a median build year of 1982 on a metro population of 152,712; Columbia, MO (124 miles) medians 1990 on 219,062; Springfield, MO (182 miles) medians 1987 on 500,694. Nearness is not sameness — a few decades of median build year separate their plumbing as surely as the miles separate their maps.

Divide the stock by the map and the densities appear: roughly 5,259 housing units for every covered ZIP code, 76,989 households to a county, 14 named communities in the grid. The balance between the generations reads 3.2 pre-1980 homes for every home built since 2000 — a single ratio that quietly predicts whether a metro's plumbing week leans toward renewal work in the old districts or first-generation upkeep in the new ones.

One line of St. Louis arithmetic — a median home 53 years old · 809,544 owner-occupied homes against 345,297 renter-occupied · 1,777 pre-1960 homes for every covered ZIP code · a heating-to-cooling degree-day ratio of 2.59 · 1,059 mm of rain in an average year.

St. Louis plumbing questions

What area does PlumbReach USA cover around St. Louis?
Every covered community in the metro — 241 ZIP codes in total, spread over Bond, Calhoun, Clinton, Jersey, Macoupin, Madison, Monroe, St. Clair, Franklin, Jefferson, Lincoln, St. Charles, St. Louis, Warren, St. Louis city. The largest share sits in St. Louis, with O'Fallon and St. Charles behind it, and the full list is printed on this page. Find your code there and the routing takes a single call. Put the coverage against the Census map and it tracks the population: St. Louis first (10.4% of the metro), then the rings of suburbs and smaller communities in their own building decades — all of it inside the same routing. If a street sits between St. Charles and St. Peters, it is in; the list was drawn from the Census map of the metro — 15 counties, 241 codes — rather than from a radius around a shop. 1,154,841 households, 2,809,414 residents, a median build year of 1973: the coverage is drawn around exactly that population, from St. Louis out to St. Peters. Stated as the communities it covers: the community ledger reads St. Louis (293,109 residents), O'Fallon (92,697), St. Charles (71,048), St. Peters (58,200) and Florissant (51,915), out of 2,809,414 residents metro-wide.
If my St. Louis house dates to about 1973, where does a plumber look first?
Start with whatever is original. A the 1970s build in Bond County has likely kept some of its first plumbing — and with 745,204 pre-1980 homes across the metro, plumbers here open walls on that stock every week. The tells are gradual: pressure a little weaker than last year, a drain cleared a little more often, a heater recovering a little more slowly. None of them is an emergency; together they are a timetable. In St. Louis that plays out across 241 ZIP codes, from St. Louis to O'Fallon. The same watch-list runs metro-wide: from O'Fallon (92,697 residents) to St. Charles (71,048) and St. Peters, across Bond, Calhoun, Clinton, Jersey, Macoupin, Madison, Monroe, St. Clair, Franklin, Jefferson, Lincoln, St. Charles, St. Louis, Warren, St. Louis city, the 745,204 pre-1980 homes share the materials this answer describes — which is why a neighbour's leak two streets away is worth a homeowner's attention here. The same applies street by street in Bond County: a median year of 1973 is an average, and the homes on either side of it — older in the core, newer past St. Peters — read from the same materials list. The geography repeats the arithmetic: O'Fallon (92,697 residents) and St. Charles (71,048) hold the same spread of eras as the core around St. Louis, across 241 ZIP codes and Bond, Calhoun, Clinton, Jersey, Macoupin, Madison, Monroe, St. Clair, Franklin, Jefferson, Lincoln, St. Charles, St. Louis, Warren, St. Louis city. The watch-list's territory in codes: the codes run 62001, 62253, 63079, 63390 and 63115 among the 241 on the list, spread over Bond, Calhoun, Clinton, Jersey, Macoupin, Madison, Monroe, St. Clair, Franklin, Jefferson, Lincoln, St. Charles, St. Louis, Warren, St. Louis city.
What fills a St. Louis plumber's diary more than anything else?
Count from the housing up and the answer is ageing cast iron sewer lines. Cast iron was the standard sewer material for homes built through the middle of the last century, and St. Louis still has a great deal of it underground: 33.8% of homes here were built before 1960 and 58.8% before 1980. The runner-up patterns on this page matter too — a metro rarely specialises in a single fault — but the leader is the leader because St. Louis's mix of eras and weather manufactures it at scale. The backdrop is the same metro-wide: 1,267,353 housing units working against the ST LOUIS LAMBERT INTL AP, MO US climate record. For scale, the runner-up is galvanized pipes at the end of their life, and the gap between them is the metro's own arithmetic: housing counted across Bond, Calhoun, Clinton, Jersey, Macoupin, Madison, Monroe, St. Clair, Franklin, Jefferson, Lincoln, St. Charles, St. Louis, Warren, St. Louis city, weather logged at ST LOUIS LAMBERT INTL AP, MO US, and an era profile with a median of 1973. Change one input and the order moves: at ST LOUIS LAMBERT INTL AP, MO US the record reads 4,433 heating degree days against 1,713 cooling; in the stock, 33.8% predates 1960 and 58.8% predates 1980. The inputs behind the ranking, community by community: the community ledger reads St. Louis (293,109 residents), O'Fallon (92,697), St. Charles (71,048), St. Peters (58,200) and Florissant (51,915), out of 2,809,414 residents metro-wide.
Is St. Louis's climate hard on pipes, or is that just something plumbers say?
Through repetition. Nothing in St. Louis's record is a freak event — 4,433 heating degree days, 1,713 cooling degree days, year after year within a narrow band — and plumbing fails by repetition more than by drama. A joint flexed by soil movement ten thousand times, a heater cycled through fifteen summers of this demand, a trap dried out every hot spell: the climate's real tool is patience, and the housing stock's age — median 1973 — is how long it has had to work. Read the record as the station logs it — ST LOUIS LAMBERT INTL AP, MO US, the NOAA station nearest this metro's centre: 4,433 heating degree days against 1,713 cooling degree days in a normal year. Every pattern ranked on this page was scored against those two numbers and the housing figures beside them. It is the same story from O'Fallon to St. Charles — the stock decides, and this stock's median build year is 1973. That is the metro-wide version; the household version differs by exposure — a shaded lot in O'Fallon, an open slab in St. Charles (71,048 residents), a crawl space in St. Peters — but the loads themselves, 4,433 heating degree days against 1,713 cooling, are the same sky over every roof in St. Louis. That is why the seasonal advice on this page is dated by ST LOUIS LAMBERT INTL AP, MO US's record rather than by a national calendar: 47.1 hot days and 84.9 freezing nights draw the two working seasons here. The numbers in one line: 57.4 degrees average, 41.7 inches of precipitation, 4,433 heating degree days, 1,713 cooling degree days, 47.1 days at 90 or above, 84.9 nights at freezing or below. The stock under that sky, counted: the era ledger reads 428,365 homes before 1960, 316,838 from 1960-1979, 287,689 from 1980-1999 and 234,460 since 2000 — 1,267,353 units, 1,154,841 households, 70.1% of them owner-occupied.
A pipe just burst at my St. Louis house — what are the first three things to do?
Do not hunt for the leak; hunt for the valve. While water is moving, its source matters less than its supply. The shutoff for most St. Louis homes is at the meter by the street or where the main line enters the building — close it and the emergency becomes a mess instead of a disaster. Then drain the system from its bottom tap, keep feet and hands away from any socket or appliance the water has reached, and call with the damage already stopped. Across the metro's 15 counties, Bond County included, the pattern repeats wherever the housing matches. Where the valve lives in St. Louis follows the build decade: the 745,204 pre-1980 homes shut off indoors or at a curb stop, the slab subdivisions toward St. Peters at the meter box — and ST LOUIS LAMBERT INTL AP, MO US's 84.9 freezing nights a year are why the calm-day search for it matters here more than in milder metros. The calm-day homework for this metro: walk the 241 covered ZIP codes' worth of housing in your mind to your own valve — in Bond County the older stock hides it indoors, the slab tracts past St. Charles at the meter — and turn it once before you ever need it in anger. The calm-day version, localised: find your valve before ST LOUIS LAMBERT INTL AP, MO US's next freeze season — 84.9 freezing nights a year — whether your home sits near St. Louis, out in O'Fallon (92,697 residents) or past St. Charles (71,048). True in every covered code: the codes run 62001, 62253, 63079, 63390 and 63115 among the 241 on the list, spread over Bond, Calhoun, Clinton, Jersey, Macoupin, Madison, Monroe, St. Clair, Franklin, Jefferson, Lincoln, St. Charles, St. Louis, Warren, St. Louis city — the first minute is the same in all of them. The ranking that frames the damage: Ageing cast iron sewer lines first on this page, galvanized pipes at the end of their life second, freeze-burst pipes in cold snaps third — the burst line in front of you belongs to the same local arithmetic. The calm-day version of this answer is a walk: the valve behind a 62001 address, the meter box on a 62253 street, the interior shutoff in a 63079 home — three eras, three addresses for the same valve, all inside this metro's 241 codes.
When does a St. Louis house cross the line from repairs to a full repipe?
It is less about age than about evidence. A sound copper system from the 1970s with a single failed joint is a repair, full stop. The repipe case builds when the same material fails in different places — and with 745,204 pre-1980 homes in this metro, local plumbers see that sequence weekly. Pressure declining across every fixture at once is the other half of the verdict. Homeowners in O'Fallon (92,697) and St. Charles (71,048) read this page for the same reason — the stock there is the same stock. Drive it in any direction — out to St. Peters, back through O'Fallon — and the eras change but the materials story does not. The pattern is not evenly spread: it concentrates in the 745,204 pre-1980 homes, thickest in the founding districts and the first suburbs — the streets around O'Fallon and the old core — and thins toward St. Peters and the growth edge, where the stock is a generation younger. Streets matter to the timing: the founding districts near St. Louis reach the pattern first, the post-war ring through O'Fallon and St. Charles a decade behind, the subdivisions past St. Peters a generation behind that. Streets carry the same ledger at household scale: from St. Louis (293,109 residents) through O'Fallon (92,697) to St. Charles (71,048), the leak sequence means the same thing wherever the material matches. Where the conversations happen: the community ledger reads St. Louis (293,109 residents), O'Fallon (92,697), St. Charles (71,048), St. Peters (58,200) and Florissant (51,915), out of 2,809,414 residents metro-wide, earliest and oftenest in the founding names on that list.
What exactly does PlumbReach USA do in St. Louis, if it does not do the plumbing?
No. PlumbReach USA is a connection service: your call is routed to an independent local plumbing professional who serves St. Louis, and that professional assesses and carries out the work in your home. Our part is the routing — and these city pages, assembled from Census and climate data so you can understand your metro's plumbing before you ever need the call. The local figures behind it: 745,204 homes from before 1980 and 234,460 built since 2000, sharing one system of streets and soil. From O'Fallon to St. Peters, the model does not change: PlumbReach USA publishes the homework — this page, built from St. Louis's Census and NOAA records — and routes the call; the independent professional who serves that part of Bond, Calhoun, Clinton, Jersey, Macoupin, Madison, Monroe, St. Clair, Franklin, Jefferson, Lincoln, St. Charles, St. Louis, Warren, St. Louis city does everything at the home. The model's footprint on this page is exact: 241 ZIP codes across Bond, Calhoun, Clinton, Jersey, Macoupin, Madison, Monroe, St. Clair, Franklin, Jefferson, Lincoln, St. Charles, St. Louis, Warren, St. Louis city, 1,154,841 households — in every part of it, the professional who arrives is a local business, and PlumbReach USA's part ends at the connection. The footprint the model serves, in figures: 241 ZIP codes — 62001 to 63390 among them — 15 counties, 1,154,841 households, from St. Louis (293,109 residents) outward. The arrangement holds in every community: the community ledger reads St. Louis (293,109 residents), O'Fallon (92,697), St. Charles (71,048), St. Peters (58,200) and Florissant (51,915), out of 2,809,414 residents metro-wide.
Is there a yearly plumbing routine that suits St. Louis homes?
Treat it as a calendar rather than a list. Before the hot stretch: the heater, flushed and checked, because 47.1 days a year at 90 degrees or more will work it hard. Before the cold stretch: exposed lines insulated and the shutoff tested, against 84.9 freezing nights. Between seasons: a slow walk past every drain, trap and cleanout in the house. St. Louis's climate writes the schedule; the checks themselves are deliberately ordinary. Scale it to this metro: St. Louis's stock runs to 1,267,353 housing units, 745,204 of them built before 1980 — the checks above are written for exactly that population, in a climate that deals the metro 47.1 days of serious heat and 84.9 freezing nights a year. Scale the routine to the map and it stays the same half hour: the checks are written for a stock of 1,267,353 homes spread over Bond, Calhoun, Clinton, Jersey, Macoupin, Madison, Monroe, St. Clair, Franklin, Jefferson, Lincoln, St. Charles, St. Louis, Warren, St. Louis city, from the founding streets near St. Louis to the subdivisions past O'Fallon (92,697 residents) — one climate, one ageing pattern, one calendar. Neighbours keeping the same rhythm is the norm here — from O'Fallon (92,697 residents) to St. Charles (71,048) the checks are identical because the data behind them, a median build year of 1973, is identical in kind. Kept yearly, the routine compounds across the metro: 1,154,841 households in Bond, Calhoun, Clinton, Jersey, Macoupin, Madison, Monroe, St. Clair, Franklin, Jefferson, Lincoln, St. Charles, St. Louis, Warren, St. Louis city, from St. Louis to St. Peters, each holding one page of notes against the same two seasons. The routine's territory, in codes: the codes run 62001, 62253, 63079, 63390 and 63115 among the 241 on the list, spread over Bond, Calhoun, Clinton, Jersey, Macoupin, Madison, Monroe, St. Clair, Franklin, Jefferson, Lincoln, St. Charles, St. Louis, Warren, St. Louis city.
How were the plumbing problems on this page ranked for St. Louis?
Nobody picked them by hand. The ranking is the output of this page's two datasets — Census housing figures for the St. Louis metro and NOAA climate normals for ST LOUIS LAMBERT INTL AP, MO US — run through the same scoring every metro gets. That is why the list here leads where it leads, and why a metro built in different decades under a different sky gets a different list: the method is shared, the numbers are not. The ranking's geography is visible in the coverage grid: the patterns at the top of the list concentrate where the old stock does — the core around St. Louis, the first suburbs toward O'Fallon — while the growth communities past St. Charles (71,048 residents) pull the ranking's lower half upward year by year. A useful check on the method: run it on O'Fallon alone and the order bends toward that district's eras; run it on the whole metro — 1,154,841 households — and you get the list printed here. The evidence trail is on this page: the problem sections scored pattern by pattern, the housing profile drawn from Bond, Calhoun, Clinton, Jersey, Macoupin, Madison, Monroe, St. Clair, Franklin, Jefferson, Lincoln, St. Charles, St. Louis, Warren, St. Louis city, the climate read from ST LOUIS LAMBERT INTL AP, MO US — the ranking is the two records read together, nothing else. The scoring's raw material, code by code: the codes run 62001, 62253, 63079, 63390 and 63115 among the 241 on the list, spread over Bond, Calhoun, Clinton, Jersey, Macoupin, Madison, Monroe, St. Clair, Franklin, Jefferson, Lincoln, St. Charles, St. Louis, Warren, St. Louis city. The dataset's own label for the unit being scored: the St. Louis metro — 2,809,414 residents, 70.1% of them owner-occupiers — scored whole, because its housing and its weather arrive whole. The sort ran over the whole list — from 62001 and 62253 through 63079, 63390 and 63115 to 62006 — and returned one order for all of it, because the inputs were the metro's totals, not any single district's.
Where are St. Louis's oldest homes, and why does it matter for plumbing?
Follow the building dates. St. Louis's pre-1960 stock — 428,365 homes, 33.8% of the metro — concentrates in the old core and the inner suburbs, and its plumbing is the metro's oldest by the same margin. The growth rings repeat the pattern at intervals: each era's building district carries that era's pipe materials, so a plumber can often guess a home's system from its street before the door opens. Put the eras on the same map and the pattern sharpens: the 428,365 oldest homes cluster centrally, the 316,838 homes of 1960-1979 ring them, and the stock thins into new subdivisions past St. Charles. A plumber driving outward from St. Louis is driving forward through plumbing history, decade by decade. Concentrations, for the record: the oldest systems sit inside the 428,365 pre-1960 homes, and those homes cluster — the founding core, the streetcar-era streets, the first suburbs in Bond County — rather than scattering evenly across the 241 covered ZIP codes. The layers have counts: 428,365 homes in the oldest ring, 316,838 in the 1960-1979 ring, 234,460 since 2000 at the edge — the drive out from St. Louis passes them in order. It is a population map as much as a plumbing map: 2,809,414 residents, 1,154,841 households, and the oldest pipework concentrated where the earliest of them settled — the founding districts of Bond County. The map's own numbers: the era ledger reads 428,365 homes before 1960, 316,838 from 1960-1979, 287,689 from 1980-1999 and 234,460 since 2000 — 1,267,353 units, 1,154,841 households, 70.1% of them owner-occupied. The comparison that proves the layering: Jefferson City, MO, 99 miles off, layers its own eras differently; Columbia, MO, 124 miles, differently again; Springfield, MO, 182 miles, differently a third time — each metro's oldest map is its own.
If a plumber assessed my St. Louis home tomorrow, what would they look at first?
In a metro with a median build year of 1973, the flags repeat: shutoff valves that no longer turn, a water heater living past its anode's protection, drains whose behaviour nobody has tested under full use, and supply lines in the era's original material. The check itself is undramatic — valves exercised, the meter watched, the heater's age read off its plate — but in housing of this age it finds the small failures while they are still small. The metro's figures say why the order matters here: 745,204 pre-1980 homes means shutoffs and heaters of a certain age are the statistical norm rather than the exception, and a climate of 4,433 heating degree days works every heater in Bond County hard enough to justify its place near the front of the walk. District by district, the same half hour: in Bond County's oldest homes the flags are materials; in the middle ring, around O'Fallon (92,697 residents), they are valves and heaters; at the growth edge they are cartridges and first questions about lines under slabs. The shortlist is drawn from this metro's evidence: 745,204 pre-1980 homes for the valves and materials, 47.1 hot days for the heater sediment, 41.7 inches of rain for the buried lines the meter reports on. District accents, with figures: O'Fallon (92,697 residents) leans to valves and materials, St. Charles (71,048) to heaters and drains, St. Peters to first-generation fixtures — one walk, three readings. The walk's districts, named: the community ledger reads St. Louis (293,109 residents), O'Fallon (92,697), St. Charles (71,048), St. Peters (58,200) and Florissant (51,915), out of 2,809,414 residents metro-wide.
How many homes does this page's data cover in the St. Louis metro?
The figures on this page come from the Census Bureau's American Community Survey for the St. Louis metro: 2,809,414 residents, 1,267,353 housing units and 1,154,841 households, with a median build year of 1973. The climate figures come from NOAA's 1991-2020 normals at ST LOUIS LAMBERT INTL AP, MO US, the station nearest the metro's centre.

Before an emergency, read the guide: How to shut off your home's water main

Nearby metro areas

One call to a St. Louis plumber

PlumbReach USA routes your call to an independent local plumbing professional serving St. Louis — the assessment and the work are theirs.

Call center hours: Mon-Fri 7:00 AM-10:00 PM ET | Sat 8:00 AM-10:00 PM ET | Sun 7:00 AM-9:00 PM ET

Call Now
