

This is Kansas City's plumbing page, built from Kansas City's own numbers: Census housing figures, the metro's ZIP codes and its NOAA climate record. PlumbReach USA routes your call to an independent local plumber; the homework below is here so you know your home's likely problems before you ever make it.
Call center hours: Mon-Fri 7:00 AM-10:00 PM ET | Sat 8:00 AM-10:00 PM ET | Sun 7:00 AM-9:00 PM ET
The median Kansas City home was built in 1979; 51.3% of the stock predates 1980, and the pattern this metro's own data ranks first is ageing cast iron sewer lines. PlumbReach USA is a referral service, not a plumbing company: one call connects you with an independent local plumber serving your ZIP code.
Start with the raw material: 2,202,006 people, 950,404 housing units, and a housing stock whose middle home was built in 1979. That single date organises everything on this page. On one side of it stand the older districts — 25.9% of homes predate 1960, 51.3% predate 1980 — plumbed in galvanized steel, cast iron and clay, in homes across Johnson, Leavenworth, Linn, Miami, Wyandotte, Bates, Caldwell, Cass, Clay, Clinton, Jackson, Lafayette, Platte, Ray that have been repaired piecemeal for decades. On the other side, the 23.5% built since 2000 run plastic lines under slabs, and fail in the newer ways. A Kansas City plumber reads a home's build year the way a doctor reads a chart: it predicts, before a single wall is opened, which systems deserve suspicion first.
Ask how Kansas City's older homes have been kept and the honest answer is: in pieces. A water heater here, a repipe there, one bathroom renewed while the rest of the system carries on — across 487,557 pre-1980 homes, the patchwork is the norm rather than the exception. That history is written in the walls of Johnson County and everywhere else the early stock stands: systems that are part original, part renewed, and entirely individual. It is also why the guidance on this page keeps returning to patterns rather than single faults — in a patchwork system, the pattern is the diagnosis.
The growth side of the metro tells the opposite story in the same language. Overland Park, Olathe and the subdivisions still filling in account for much of the 223,345 homes built since 2000 — plastic supply lines, plastic drains, cartridge fixtures, slab foundations. Their plumbing is not old; it is uniform, which creates its own calendar: everything installed in the same boom reaches each wear point in the same years, from the first water-heater replacements to the first slab-leak scares, while 1,446 cooling degree days of annual heat keep demand on the system high.
One more record sits over the whole metro, and it is the one the pipes themselves keep: the weather's. LEES SUMMIT MUNI AP, MO US logs 38.34 inches of precipitation in an average year and swings between 37.7 days at 90 degrees or more and 96.3 nights at or below freezing. Buried lines ride that swing in the soil; heaters ride it in their cycle counts; exposed runs ride it at the extremes. Cross the swing with the housing ages above and the selection of problems further down this page stops looking like a list and starts looking like an arithmetic result.
Two public records, one metro: what was built here, and what the sky does to it.
The distribution, in one breath: of every hundred Kansas City homes, 25.9 were standing before 1960, 25.4 went up in the two decades after, 25.3 in the two after that, and 23.5 have arrived since 2000. Percentages flatten the picture, so hold the counts beside them — 246,155 oldest-era homes, 223,345 newest — and the metro's plumbing stops being an abstraction: it is that many systems, of those ages, failing in that order.
The centre of gravity here is the deep stock: with pre-1960 homes the largest single band, Kansas City's typical plumbing conversation starts with materials that have been underground or in walls for sixty years and more — cast iron drains at the end of their design lives, galvanized runs narrowed by corrosion, and laterals that predate the neighbourhoods around them. Newer work exists, out at the growth edge, but the metro's character — and most of its serious plumbing — sits in the old core and the streets that grew from it.
The second band in the table is the 1960-1979 stock: 241,403 homes, 25.4% of the metro. It is the transition generation — copper arriving, galvanized lingering, drains mixed street by street — and it supplies Kansas City with its most diagnostic plumbing: two homes of the same year needing opposite answers, decided by what the builder happened to specify.
The climate half of the profile, from LEES SUMMIT MUNI AP, MO US: 4,786 heating degree days against 1,446 cooling degree days, 38.34 inches of precipitation, an average temperature of 55.7 degrees. Read together, those figures describe the loads: how hard heaters cycle, how often the soil around buried lines swells and shrinks, and how much of the year exposed pipework spends anywhere near freezing — 96.3 nights at or below it, against 37.7 days at 90 or above.
That is the whole method of this page in one section: era shares from the Census, loads from NOAA, and a problem list that is simply where the two overlap most in Kansas City. The services and guidance that follow are ordered by the same profile — local first, generic last.
Sequenced by this metro's own problem ranking, not by a national catalogue order.
A house can survive a lot of plumbing faults, but not a failed path to the street. Sewer services confront the lateral directly — inspected by camera, cleared where clearing suffices, excavated and renewed where the pipe has structurally given up. The footage, shown to the homeowner, is the basis of every recommendation.
The case for camera-first sewer work is written in this metro's building history. Kansas City's laterals run in clay, iron, early plastic and modern plastic depending on the decade of the street — four materials with four failure styles and four different correct repairs. Treating them as one material invites the classic error: clearing a collapsed clay line as though it were a blocked plastic one, and booking the household for a repeat performance. The survey removes the guesswork at the start, when it is cheapest to remove, and every recommendation that follows can point to footage rather than opinion. The LEES SUMMIT MUNI AP, MO US record — 4,786 heating degree days, 1,446 cooling — is the backdrop Johnson County plumbers plan around.
Sewer demand follows the founding map: the districts built first, around the old centre and out through Overland Park, hold the jointed clay and iron; the growth rings hold plastic with decades in hand. 25.9% of the metro's homes stand on the founding side of that line, which is why the footage here so often shows a pipe at the end of its story.
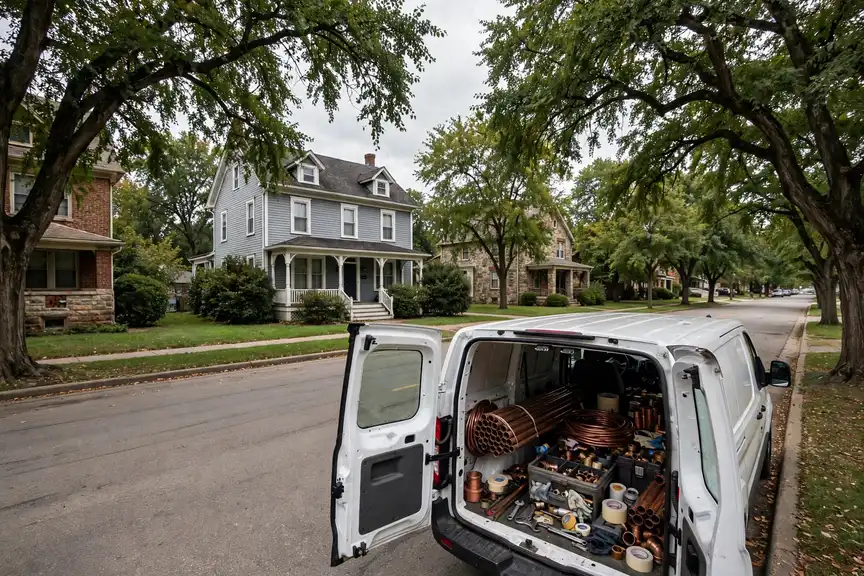
Where this service gets booked in Kansas City follows the map on this page: the older districts generate the deep-end work, the post-2000 subdivisions the wear-and-tear work, and the 240,452 homes in between split the difference. Telling the call center your home's build decade — most Kansas City owners know it within a few years — puts the right kit on the van the first time.
Every pipe material carries a lifespan, and pipe services are how a house changes generations. Sectional repair buys time on a sound system; full repiping retires a tired one, replacing choked or pitting lines wall by wall and leaving the household with pressure and water quality it may not have had in years.
Not every old pipe in Kansas City needs replacing, and the assessment matters: a sound copper system from the 1970s with one failed joint is a repair; a galvanized system with rust at every exposed fitting is a repipe waiting for its date. The metro's newer subdivisions (23.5% built since 2000) sit this conversation out for now — their turn comes decades from now. For the older stock, the job is planned around the household: routes through accessible spaces, water restored in stages, and openings kept to where lines actually have to pass. Ask in Independence and the answer rhymes with Kansas City: same eras, same materials, same calendar of failures.
The repair-or-renew caseload is set by one figure above the rest: 51.3% of Kansas City homes predate 1980, plumbed in the materials now at the end of their service lives. Around Independence (121,944 residents) as in the old core, that percentage is not an abstraction — it is the street's plumbing, house by house.
In Kansas City this service is booked most often through the problem patterns at the top of this page — the metro's housing data, not habit, sets the order. If your home is in the 51.3% built before 1980, mention its age on the call: it changes the parts the plumber loads before heading to Kansas City and the rest of the metro.
A heater rarely dies all at once; it dims. Recovery slows, temperatures wander, the tank starts talking. Repair makes sense while the vessel is sound; once the steel itself is going, replacement is the honest answer, matched in capacity and fuel to how the household actually uses hot water.
The age profile of Kansas City homes shapes its water heater work. The median home here was built in 1979, and a good share of heaters in the metro are replacements of replacements — tanks swapped into older plumbing, sometimes into tight closets and attics that make the swap itself the job. When a heater in one of the metro's pre-1980 homes (51.3% of the stock) fails, the visit often includes the shutoff valve and supply lines too, because they have aged alongside the tank. Sizing the new unit to the household's peak hour matters more than matching the old tank's label. With a median build year of 1979, most of the metro's 950,404 housing units are working through the same ageing curve.
The arithmetic behind the diary: 882,252 households heating water through 1,446 cooling degree days and 4,786 heating degree days a year — every one of those households a tank ageing on the same climate's schedule, from the pre-war homes to the newest builds around Shawnee.
One local habit worth copying: Kansas City homeowners who mention their street's building era when they book get a better-matched visit, because a plumber heading to a the 1970s home in Johnson County loads different parts than one heading to a slab-built subdivision in Overland Park. The service is the same; the preparation is local.
In Kansas City the emergency call is routed, not queued: one number reaches the independent local plumber covering Johnson, Leavenworth, Linn, Miami, Wyandotte, Bates, Caldwell, Cass, Clay, Clinton, Jackson, Lafayette, Platte, Ray at that hour, and the housing record on this page — median build year 1979 — is the homework they arrive already knowing.
Drain work in Kansas City splits by era: the 487,557 pre-1980 homes drain through older materials, the post-2000 subdivisions through plastic — and the local plumber reads the cable's return to tell which world your street drains through.
The meter test starts it in Kansas City as everywhere; what follows is local — knowing which of Johnson, Leavenworth, Linn, Miami, Wyandotte, Bates, Caldwell, Cass, Clay, Clinton, Jackson, Lafayette, Platte, Ray' eras hide lines in slabs, which in crawl spaces, and where the soil movement at LEES SUMMIT MUNI AP, MO US's record makes joints let go.
Running, rocking or refusing — in Kansas City the diagnosis is the same short sequence: fill valve, flapper, supply line, flange. The plumbers routed here carry the internals for the fixtures this metro's eras installed.
Fixture work in Kansas City divides by era like everything else on this page: washer-era taps in the older districts, cartridge internals in the post-2000 subdivisions — the local plumber stocks for both.
Bookings in this metro have a centre of gravity, and it sits on the two patterns this page ranks first: Ageing cast iron sewer lines, then freeze-burst pipes in cold snaps. Everything a local service operation does — the vans' stock, the week's scheduling, the order of this very list — bends around that gravity. A homeowner reading the services above is therefore reading something more specific than a menu: a forecast of what a home like theirs, in a metro built like this one, is most likely to need, in the order it is most likely to need it.
Chosen by this metro's own housing and weather data — the same two records this whole page is built from.
Read a cast iron drain's age in its symptoms and the progression is orderly. First the line slows — not blocked, just reluctant, as scale roughens the bore and catches what passes. Then the complaints localise: one branch backing up, then another, as sections of the run reach their own stages of narrowing. In Kansas City's oldest districts that progression plays out across whole streets of the 1970s housing at once, because the lines were laid in the same years from the same material. The camera distinguishes the stages house by house: a bore narrowed by scale that cleaning can restore, against a wall thinned and cracked past any cleaning's help.
There is a temptation to judge an old drain by its kindest day. On its kindest day it still clears, still serves, still seems to argue for another year. Judge it instead by its trend: clearings that come closer together, a tub that drains slower each season, a smell that returns after rain. In the 246,155 pre-1960 homes across this metro, that trend is the pipe's biography being read aloud — corrosion does not pause between visits, and the homes that fare well are the ones whose owners believed the early chapters.
Another way to size the exposure: Kansas City's pre-1960 homes — roughly 246,155 of them — were plumbed in an era when cast iron was not a choice but the standard. Their drains have now spent sixty-plus winters and summers expanding, contracting and carrying loads their installers never pictured, which is why this pattern outranks problems that belong to younger housing.
Ice does its damage in silence and announces it in flood. The split forms under pressure while the line is frozen, holds while the ice plug seals it, and opens the moment the thaw restores flow — which is why burst pipes are so often discovered by sound: water running somewhere it should not be, in a house that was intact at breakfast. Kansas City's exposure sits where its housing does — in the older districts' unprotected runs and every era's additions and garages — and the repair visit's second job, after the pipe itself, is the insulation and routing that keep the same night from repeating.
A burst pipe is rarely about the coldest night of the year; it is about the one unprotected run of pipe the cold can reach. Water expands as it freezes, and the pressure that splits a line is not the ice itself but the water trapped between the ice blockage and a closed tap. Lines in exterior walls, unheated crawl spaces, garages and hose bibbs are the usual victims — the places where a home's heating never quite arrives. Kansas City's older housing carries more of these runs than its newer builds, which route water through conditioned space by design. The thaw is when the damage shows: the split may weep for hours before anyone is home to hear it, which is why the shutoff advice on this page matters more than any repair.
The exposure is written in the climate record: LEES SUMMIT MUNI AP, MO US averages 96.3 nights a year at or below freezing, and it takes only one hard night to split an unprotected line. The housing side of the equation is the metro's older stock — homes from the 1970s and earlier, plumbed before freeze protection was routine, with lines in exterior walls and unheated crawl spaces that modern builds route through conditioned space instead.
Every lateral in Kansas City is a private road with a public destination, and like a road it wears where the traffic and the ground conspire: at the joints. Sections laid generations ago were joined to the standards of their day, and the decades since have worked each joint individually — a fraction of movement here, a root hair there. The ground-floor fixtures report the cumulative result. Sewer service is the survey of that road, cleanout to street, and its recommendations scale with the survey: a joint renewed, a section replaced, or — where the whole run has given up — a new road laid on the old one's line.
Slope is the lateral's invisible specification. A sewer line does not need much fall — a quarter inch per foot is the classic figure — but it needs it consistently, and ageing takes consistency away: a section settles, a joint steps down, and the line develops a reach where flow slows and solids settle out. That belly then collects a little more each week, narrowing the line from the bottom up. Many a Kansas City lateral diagnosed as 'blocked' is really 'bellyed' — clearable today, certain to collect again. The camera distinguishes the two, and the distinction decides whether the household is booking a cleaning or planning a repair.
Every one of the metro's 950,404 housing units drains through exactly one lateral, and in the older districts those laterals are as old as the streets above them. The pre-1960 share alone — 246,155 homes — represents that many buried lines in their seventh decade of service, under soil that shifts with Kansas City's wet and dry seasons. Most will never draw attention; the ones that fail announce themselves through the ground-floor fixtures first.
The galvanized story can be told at a single tap. Open the fixture farthest from the meter in a Kansas City home still on its original steel and watch the stream: respectable for a moment, then thinning as the narrowed runs upstream ration the flow. That rationing is the material's old age made visible — decades of internal rust taxing every gallon. The metro holds 487,557 pre-1980 homes, and in the ones never repiped, the tax rises yearly. Unlike most plumbing failures, this one is perfectly forecastable: the tap has been reporting it, patiently, for years.
The geography of galvanized failure inside one house is uneven, and the unevenness misleads people. The runs nearest the water heater corrode fastest, worked by heat; long horizontal runs narrow differently from vertical risers; the line to a little-used guest bathroom may be nearly closed while the kitchen still flows. This is why a Kansas City home can seem fine at most taps while one shower has given up entirely. Repiping answers the whole geography at once, which is its real argument: not that any single run has failed, but that the system's remaining life is scattered unevenly through every wall, and spot repairs keep buying the shortest-lived section.
Count the exposure from the Census side: the metro's 487,557 pre-1980 homes were plumbed in galvanized's long reign, and the material's failure mode — internal rust, narrowing bore — is a matter of chemistry, not workmanship. The variable is speed; the direction, for every one of those systems still original, is settled.
A water heater under strain complains in a consistent order. First the recovery slows: back-to-back showers end in a lukewarm truce. Then the noises begin — sediment on the tank floor superheating pockets of water into small, kettle-like pops. Then the pilot or the elements start their intermittent failures. In Kansas City the strain is structural: 1,446 cooling degree days of demand against 4,786 heating degree days of cold inlet water, cycling the metro's tanks without an off-season. Servicing interrupts the order at whichever stage it has reached; the tank's age and the sediment's depth decide whether the interruption is a repair or a retirement.
A water heater's enemies compound quietly. Sediment settling on the tank floor insulates the water from the burner or elements, so the unit fires longer to do the same work; the longer firing expands and contracts the tank steel, working the lining; the anode rod, designed to corrode in the steel's place, spends itself a little faster with every cycle. None of this announces itself until recovery slows — showers running lukewarm in sequence, a rumble from the tank as steam pockets form in the sediment — and by then the arithmetic of age has usually been running for years. Homes in Kansas City put real hours on these appliances: hot water is not a seasonal luxury here but a year-round daily load, and the fleet of heaters across the metro ages in step with the housing that holds it.
The demand side, from the Census: 882,252 households, most heating water daily, in a metro where the hot season runs long and the cold snaps are sharp. Appliance populations that large, worked that hard, fail on a distribution — and the distribution's peak is what a ranking like this one is measuring.
Living with a real winter, as Kansas City does, means the season has a rhythm: the first hard freeze finds the unprepared lines, mid-winter tests the insulation, and the late thaws reveal whatever split quietly weeks before. Households that drain exterior lines in autumn and keep a trickle running on the coldest nights get through most winters with nothing to report.
Winter's load on this metro can be counted two ways: in the 96.3 freezing nights LEES SUMMIT MUNI AP, MO US records, and in the age of the housing that must withstand them — half of it built by 1979 or earlier. Neither number alone predicts a burst; multiplied together, they predict a season. Local plumbers plan their winter around that product, and households in the older districts do well to plan their autumn the same way.
There is a reason this pattern tops so many old-metro lists, and Kansas City holds the reason in bulk: iron was simply what drains were, for the whole first age of indoor plumbing. Every pre-1960 home still on its original line — and the Census counts 246,155 pre-1960 homes here — is running an experiment in how long buried iron can serve. The results arrive unevenly: one street's lines camera clean and sound, the next street's flaked to lace. That unevenness is why the deep-dive ends in a camera rather than a conclusion, and why two neighbours with identical houses can honestly need different work.
Read the ranking backwards and it reads as a data summary: 2,202,006 residents in 950,404 housing units, 25.9% of the housing from before 1960, 38.34 inches of rain in an average year. The pattern leads because the exposure is broad — counted not in individual unlucky houses but in whole eras of the metro's building, stacked one on another.
On a first visit for this pattern, a local plumber's checks run in a practised order:
 PROBLEM
 SOLUTION
Population 508,233
Population 197,199
Population 143,720
Population 121,944
Population 102,583
Population 68,175
Population 59,416
Population 57,986
Population 37,176
Population 33,844
Population 30,446
Population 29,593
Also in the Kansas City metro: Gladstone (population 27,069), Grandview (population 25,821).
Read the grid as a building programme spread over a century. The oldest communities sit where the metro began; the youngest are still adding streets at its edge; and Overland Park and Olathe, with 197,199 and 143,720 residents, stand for the rings in between. Each ring plumbed in its era's materials, and each is now failing, wearing or holding in its era's characteristic order. The ZIP codes below draw the coverage boundary; the eras inside it draw everything else on this page — the problems ranked, the services ordered, the checks advised.
Also on the Kansas City map: Independence (121,944), Lee's Summit (102,583), Shawnee (68,175), Blue Springs (59,416), Lenexa (57,986) — communities spread across Johnson, Leavenworth, Linn, Miami, Wyandotte, Bates, Caldwell, Cass, Clay, Clinton, Jackson, Lafayette, Platte, Ray, each with housing from its own growth years. A plumber routed through PlumbReach USA to any of them is working from this same page: the metro data does not change at the city limit, but the housing on your street — its age, its materials, its soil — is what the visit is really about.
Start with Kansas City itself: 508,233 residents, 23.1% of the metro — the centre the rest of the map orbits. Overland Park (197,199) and Olathe (143,720) form the next ring out, housing with its own building decades and its own plumbing generations. Beyond them the metro thins into the smaller communities in the grid above, each a few thousand households deep — small in population, identical in one respect: their pipes answer to the same eras and the same weather as the big city's.
Draw the metro by its paperwork and it resolves into Johnson, Leavenworth, Linn, Miami, Wyandotte, Bates, Caldwell, Cass, Clay, Clinton, Jackson, Lafayette, Platte, Ray — 14 jurisdictions sharing one housing stock and one weather system. Johnson County holds the historic centre and the densest share of the older homes; the surrounding counties hold the rings of growth around it. Permits and inspections follow those boundaries even though water never does, which is part of why the plumber this page connects you to works these streets specifically.
Three neighbouring coverage areas begin where this one ends: Columbia, MO, some 101 miles off; Jefferson City, MO, 128 miles; and Joplin, MO, 133 miles. Each keeps its own page because each keeps its own numbers — a different median build year, a different climate station, a different problem ranking. Boundary households should trust the ZIP list over the map: the code, not the compass, assigns the dataset.
The region around Kansas City is a set of variations on its theme: Columbia, MO, 101 miles off, runs a median build year of 1990 on a metro population of 219,062; Jefferson City, MO (128 miles) medians 1982 on 152,712; Joplin, MO (133 miles) medians 1982 on 208,796. Nearness is not sameness — a few decades of median build year separate their plumbing as surely as the miles separate their maps.
Divide the stock by the map and the densities appear: roughly 4,659 housing units for every covered ZIP code, 63,018 households to a county, 14 named communities in the grid. The balance between the generations reads 2.2 pre-1980 homes for every home built since 2000 — a single ratio that quietly predicts whether a metro's plumbing week leans toward renewal work in the old districts or first-generation upkeep in the new ones.
The Kansas City record in one line — median home age: 47 years · owner-occupied homes: 578,757 · renter-occupied homes: 303,495 · pre-1960 homes per covered ZIP code: 1,207 · heating-to-cooling degree-day ratio: 3.31 · average rainfall: 974 mm a year.
Before an emergency, read the guide: How to shut off your home's water main
PlumbReach USA routes your call to an independent local plumbing professional serving Kansas City — the assessment and the work are theirs.
Call center hours: Mon-Fri 7:00 AM-10:00 PM ET | Sat 8:00 AM-10:00 PM ET | Sun 7:00 AM-9:00 PM ET