

Home / Cities / Illinois / Peoria

Plumbing Services in Peoria, IL

This is Peoria's plumbing page, built from Peoria's own numbers: Census housing figures, the metro's ZIP codes and its NOAA climate record. PlumbReach USA routes your call to an independent local plumber; the homework below is here so you know your home's likely problems before you ever make it.

Call center hours: Mon-Fri 7:00 AM-10:00 PM ET | Sat 8:00 AM-10:00 PM ET | Sun 7:00 AM-9:00 PM ET

66
ZIP codes covered
5
Counties in the metro
152,843
Households (Census ACS)
1967
Median year home built
Peoria, IL — the metro skyline and landscape
Peoria, IL — plumbing help across the metro
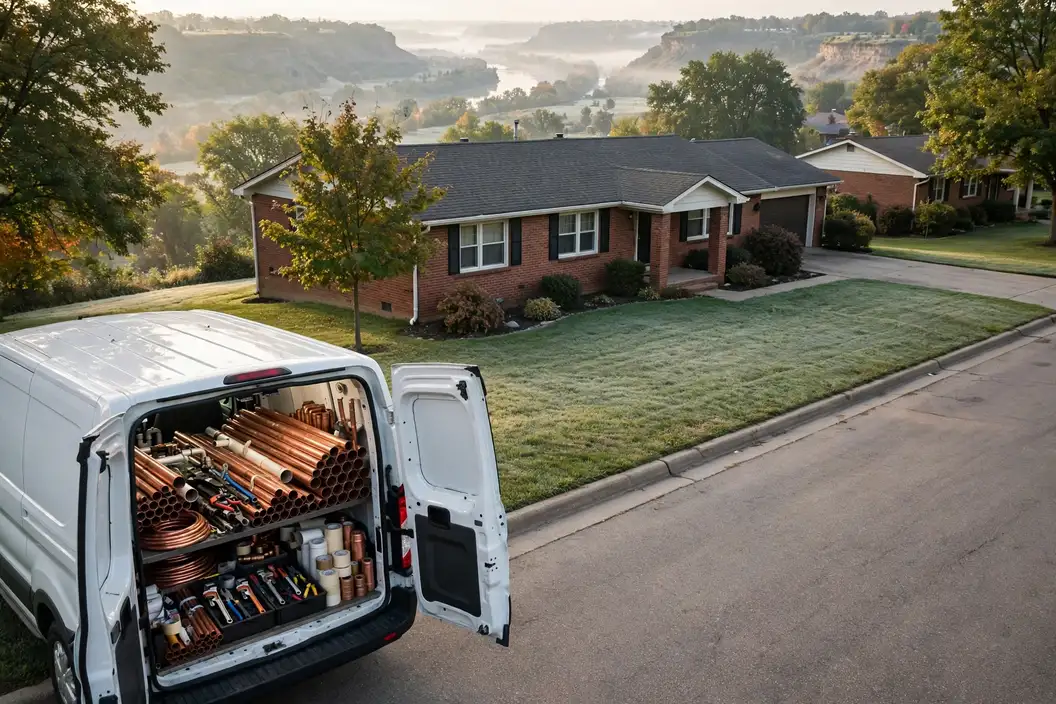
A local plumber's van on a residential street
Local plumbers serving Peoria neighbourhoods
Water heater installation in a home garage
Replacing a heater in a Peoria home

Peoria plumbing, in brief

The median Peoria home was built in 1967; 71.0% of the stock predates 1980, and the pattern this metro's own data ranks first is ageing cast iron sewer lines. PlumbReach USA is a referral service, not a plumbing company: one call connects you with an independent local plumber serving your ZIP code.

The Peoria housing stock, and what it means for plumbing

Every metro is really several, stacked by decade. Peoria's stack, per the Census, reads: 40.4% of homes from before 1960, a thick middle from the growth decades, and 14.7% from 2000 onward — 167,809 housing units in all, wrapped around a median build year of 1967. Plumbing follows the stack faithfully. Each layer went in with its era's materials and workmanship, and each layer is now failing in its era's characteristic order. This page keeps the layering in view throughout, because in a stacked metro the first diagnostic question is never what broke — it is which layer the home belongs to.

The pre-1980 stock is where most of the metro's plumbing character lives. Homes from those decades in Marshall County and across Marshall, Peoria, Stark, Tazewell, Woodford were built with galvanized supply lines, cast iron or clay drains and first-generation fixtures, and each of those materials is now at or beyond the age its makers expected of it. Owner-occupiers hold 72.9% of the metro's homes, so most of the people reading this page are reading about a system they own outright — one whose failures arrive as surprises only if nobody has looked at the pattern: pressure fading a little each year, a drain that needs attention a little more often, a heater that recovers a little more slowly.

Growth wrote this metro's newest plumbing chapter in plastic and concrete: supply and drain lines in modern materials, fixtures by the catalogue, foundations poured as slabs across the subdivisions near Pekin and East Peoria. The chapter is young — its systems have decades in hand — but it is not exempt from the metro's arithmetic: 1,157 cooling degree days of demand work its heaters hard, and the soil under its slabs moves with the same seasons as the soil under the oldest farmhouse in Marshall County.

The weather's part in this is written at PEORIA GTR PEORIA AP, IL US, where an average year carries 37.55 inches of precipitation, 23.2 days at ninety degrees or more and 117.7 nights at freezing or below. Pipes experience that year as workload and as hazard in roughly equal measure — the workload in the heater's cycle count and the drains' burden, the hazard in the exposed runs and the swelling soil. The problem ranking further down is simply the housing profile above, read under this sky.

The Peoria plumbing profile in numbers

Two public records, one metro: what was built here, and what the sky does to it.

Lay the eras side by side instead: 40.4% pre-1960 (67,795 homes), 30.6% from 1960-1979 (51,350), 14.3% from 1980-1999 (23,997), and 14.7% since 2000 (24,668). No single era tells the story — the proportions among them do, and those proportions are different in every metro this site covers.

This is, by the numbers, an old-system metro. The largest slice of its housing predates 1960, which means the typical serious job here involves materials in their seventh decade or beyond: drains of cast iron or clay, supply runs in galvanized steel, laterals laid when the streets themselves were young. The newer bands exist — the growth since 2000 is real — but they are the supporting cast. Peoria's plumbing identity was fixed by its earliest builders, and its problem list is written in their materials.

Close behind the leader come the 1960-1979 homes, 30.6% of the stock. Their plumbing is mid-change by construction — the decades when materials swapped over mid-stream — so this band is where a Peoria plumber earns the diagnostic fee: pressure tests and camera runs that say which side of the transition a given house was built on.

The climate half of the profile, from PEORIA GTR PEORIA AP, IL US: 5,614 heating degree days against 1,157 cooling degree days, 37.55 inches of precipitation, an average temperature of 52.7 degrees. Read together, those figures describe the loads: how hard heaters cycle, how often the soil around buried lines swells and shrinks, and how much of the year exposed pipework spends anywhere near freezing — 117.7 nights at or below it, against 23.2 days at 90 or above.

Hold the two halves together and the rest of this page explains itself: the problems ranked highest here are the ones where Peoria's dominant housing era and its climate record overlap. Change either dataset and the ranking changes — which is precisely why this profile is rebuilt from the records for every metro instead of carried over from the last one.

Plumbing problems Peoria homes actually get

Chosen by this metro's own housing and weather data — the same two records this whole page is built from.

Ageing cast iron sewer lines

Read a cast iron drain's age in its symptoms and the progression is orderly. First the line slows — not blocked, just reluctant, as scale roughens the bore and catches what passes. Then the complaints localise: one branch backing up, then another, as sections of the run reach their own stages of narrowing. In Peoria's oldest districts that progression plays out across whole streets of the 1960s housing at once, because the lines were laid in the same years from the same material. The camera distinguishes the stages house by house: a bore narrowed by scale that cleaning can restore, against a wall thinned and cracked past any cleaning's help.

There is a temptation to judge an old drain by its kindest day. On its kindest day it still clears, still serves, still seems to argue for another year. Judge it instead by its trend: clearings that come closer together, a tub that drains slower each season, a smell that returns after rain. In the 67,795 pre-1960 homes across this metro, that trend is the pipe's biography being read aloud — corrosion does not pause between visits, and the homes that fare well are the ones whose owners believed the early chapters.

Count it from the Census side: 67,795 homes in this metro predate 1960, and the drain lines beneath them were cast in an era that assumed a working life now fully spent. They will not all fail at once — they will fail one street at a time, in the order the corrosion reaches, which is what makes the pattern a ranking on this page rather than a footnote.

Watch for

  • Floor drains in the basement or ground floor backing up during heavy use
  • A sewer smell near drains that cleaning does not shift
  • Patches of lawn staying green or soggy over the line's path

About sewer line repair & replacement ➔

Galvanized pipes at the end of their life

Galvanized steel pipe was plumbed into millions of homes, and it ages in a particular way: the zinc coating gives out, the steel rusts, and the rust grows inward until the pipe that once carried a full stream is choked to a fraction of its width. With a median build year of 1967 and 71.0% of its homes predating 1980, Peoria has a large stock of housing in the galvanized era, and its symptoms are the classic ones — pressure that has faded a little more each year, water that runs rusty after the house sits quiet overnight, and leaks that begin appearing at joints. No cleaning reverses this; the corrosion is the pipe itself converting to rust. The judgement call is timing. A galvanized system with one small leak and acceptable pressure can be repaired and watched. A system leaking in several places, with pressure dropping across every fixture, is telling you the material has finished its service life, and each repair buys a shorter quiet interval than the last. Repiping in PEX or copper replaces the whole question with a new system and restores the pressure the home was built with.

The geography of galvanized failure inside one house is uneven, and the unevenness misleads people. The runs nearest the water heater corrode fastest, worked by heat; long horizontal runs narrow differently from vertical risers; the line to a little-used guest bathroom may be nearly closed while the kitchen still flows. This is why a Peoria home can seem fine at most taps while one shower has given up entirely. Repiping answers the whole geography at once, which is its real argument: not that any single run has failed, but that the system's remaining life is scattered unevenly through every wall, and spot repairs keep buying the shortest-lived section.

The scale of it in Peoria: about 119,144 homes predate 1980, the decades when galvanized steel was plumbed into houses as a matter of course. Those lines have been corroding inward ever since, quietly and at different speeds — two houses on the same street in Peoria can be years apart in symptoms, but they are reading from the same page of the same story.

Watch for

  • Water running rusty-brown first thing in the morning, then clearing
  • Pressure noticeably weaker at the far end of the house than near the meter
  • Neighbours on the same street reporting the same slow decline

About pipe repair & repiping ➔

Freeze-burst pipes in cold snaps

Ice does its damage in silence and announces it in flood. The split forms under pressure while the line is frozen, holds while the ice plug seals it, and opens the moment the thaw restores flow — which is why burst pipes are so often discovered by sound: water running somewhere it should not be, in a house that was intact at breakfast. Peoria's exposure sits where its housing does — in the older districts' unprotected runs and every era's additions and garages — and the repair visit's second job, after the pipe itself, is the insulation and routing that keep the same night from repeating.

Prevention, for this pattern, is a geography lesson: the burst never happens in the middle of the heated house. It happens at the perimeter — the wall cavity on the windward side, the run beneath the addition, the pipe the builder routed through the garage to spare six feet of copper. In Peoria, where 23.2 summer days tempt everyone to forget what 117.7 freezing nights intend, the autumn ritual is short and specific: find every line that leaves the warmth, and do something about it. The households that keep that ritual read about burst pipes the way other people do — as news.

Two local numbers frame the risk: 117.7 nights a year at or below freezing at PEORIA GTR PEORIA AP, IL US, against a housing stock whose median home dates to 1967 — plumbed, much of it, before routing lines away from cold air was standard practice. Exposure is the product of those two numbers, and in this metro the product is large.

Watch for

  • A tap that runs slower after a cold night than it did the evening before
  • Frost visible on an exposed section of pipe in the garage or crawl space
  • A water bill spike in the month after a hard freeze

About pipe repair & repiping ➔

Winter pipe season in Peoria

This is the season the metro's housing stock is examined by the weather, and the examination is practical: every exposed run, every unheated void, every shutoff nobody has tested. The failures arrive in batches behind the hardest nights and announce themselves at the thaw. The rest of the season grades the slower systems too — heaters working against the coldest incoming water of the year, laterals under frozen ground — but the headline the season writes, year after year, is the sound of water in a wall that should be dry.

Put the season in figures: 117.7 freezing nights a year at PEORIA GTR PEORIA AP, IL US, against a median build year of 1967. Half of Peoria's homes are that old or older, and their exposed lines sit the winter's examination every year — the failures the season produces are simply the papers it fails.

A closer look: ageing cast iron sewer lines in Peoria

There is a reason this pattern tops so many old-metro lists, and Peoria holds the reason in bulk: iron was simply what drains were, for the whole first age of indoor plumbing. Every pre-1960 home still on its original line — and the Census counts 67,795 pre-1960 homes here — is running an experiment in how long buried iron can serve. The results arrive unevenly: one street's lines camera clean and sound, the next street's flaked to lace. That unevenness is why the deep-dive ends in a camera rather than a conclusion, and why two neighbours with identical houses can honestly need different work.

Why here and not everywhere: Peoria pairs 119,144 pre-1980 homes with 23.2 days a year at 90 degrees or more and 117.7 nights below freezing. Every metro pairs its housing with its weather somehow; this particular pairing is what puts the pattern where it sits on this page's list, ahead of problems that dominate metros built in other decades, under other skies.

The first visit follows a short, diagnostic list — each item ruling a branch of the problem in or out:

  • The ground-floor fixtures first — a main-line problem reports there before anywhere else
  • The age and material of the line, from the home's era and any past camera reports
  • Whether gurgling tracks the washing machine's discharge — a classic main-line signature
  • The cleanout's cap and condition, and whether it has ever been opened

Plumbing services in Peoria

Listed in the order this metro's housing and climate data supports.

Sewer Line Repair & Replacement in Peoria

Roots, offsets, bellies, corrosion — the camera distinguishes them, and each has a different remedy at a different scale. That is the whole logic of sewer work: see the line first, then decide whether it needs a clearing, a section, or a new run entirely.

The camera footage is where Peoria's sewer conversations get honest. From the surface, a backup is a backup; on the screen, the metro's whole history is visible — clay joints shouldered apart by decades of soil movement, cast iron scaled to half its width, a plastic line in a newer subdivision bellied where its bedding settled. Marshall County's older laterals and the growth areas' young ones fail in their own dialects, and the repair that follows the footage — sectional, partial, or the full run to the street — is the one the pipe itself argues for. Count it in homes if you prefer: 119,144 built before 1980, 24,668 since 2000, one shared system of soil and seasons.

Under Peoria lie 167,809 laterals, one per housing unit, and the oldest of them — beneath the 67,795 pre-1960 homes — have been underground since the metro was a fraction of its present size. The camera diary in Pekin and the old core is written by that buried generation.

More about sewer line repair & replacement ➔

Pipe Repair & Repiping in Peoria

One leak is an event; three in a year is a verdict. Pipe work weighs that pattern — the metal's age, the water's behaviour, the repair history — and either fixes the section in front of it or proposes the honest larger job: a whole-house repipe that ends the rhythm for good.

Stand in a Peoria street built in the metro's big decades and you are standing over a synchronised experiment: hundreds of homes plumbed in the same material, by the same crews, in the same years, now ageing in unison. Pipe work here is consequently part diagnosis, part census — the plumber reads one home's failure against the street's pattern and can often say what the neighbouring houses will need next. Sectional repair serves the home whose system is sound elsewhere; repiping serves the street-timer home, where the failures have begun arriving in rhythm and the rhythm itself is the diagnosis. The PEORIA GTR PEORIA AP, IL US record — 5,614 heating degree days, 1,157 cooling — is the backdrop Marshall County plumbers plan around.

Pipe work divides by era in this metro with unusual neatness: renewal conversations in the 119,144 pre-1980 homes, sectional repairs in the middle ring, and near-silence from the 24,668 post-2000 homes whose lines are still young. A call from Morton can sit in any of the three bands; the home's build year says which before the door opens.

More about pipe repair & repiping ➔

Emergency Plumbing in Peoria

Emergencies in Peoria are answered by local independents, not a dispatch centre: PlumbReach USA routes the call, and the stock it serves — 167,809 homes across 66 ZIP codes — is the stock this page profiles.

More about emergency plumbing ➔

Drain Cleaning in Peoria

Peoria's drains are cleared by local independents who work this stock weekly: a median build year of 1967 means most lines they open have decades of history in them, and the clearing approach is chosen for the era, not the postcode.

More about drain cleaning ➔

Water Heater Repair & Installation in Peoria

In a metro of 167,809 homes with a median build year of 1967, water heaters fail in waves as whole streets age together — the plumbers serving Marshall, Peoria, Stark, Tazewell, Woodford stock and schedule for exactly that pattern.

More about water heater repair & installation ➔

Leak Detection & Repair in Peoria

Leak detection in Peoria is instrument work over local knowledge: acoustic and thermal tools, aimed first at the districts this page's data flags — the pre-1980 stock and the slab tracts out toward East Peoria.

More about leak detection & repair ➔

Toilet Repair & Installation in Peoria

Running, rocking or refusing — in Peoria the diagnosis is the same short sequence: fill valve, flapper, supply line, flange. The plumbers routed here carry the internals for the fixtures this metro's eras installed.

More about toilet repair & installation ➔

Faucet, Fixture & Garbage Disposal Repair in Peoria

Fixture work in Peoria divides by era like everything else on this page: washer-era taps in the older districts, cartridge internals in the post-2000 subdivisions — the local plumber stocks for both.

More about faucet, fixture & garbage disposal repair ➔

What Peoria books most

Ask where this metro's plumbing diary fills up and the answer is a short story: Ageing cast iron sewer lines first, galvanized pipes at the end of their life close behind, and the services that answer them doing the bulk of the booked work. Everything else on the list above is the supporting cast — necessary, frequent enough, but not what Peoria's housing stock, at its age and in its climate, principally demands. Read the service list as a weather report for the metro's pipes and it stops looking like a catalogue.

From problem to fixed, in Peoria

A plumbing problem inside a Peoria homePROBLEM
➔
The same system in Peoria after professional repairSOLUTION

Areas covered in the Peoria metro

Peoria

Population 112,126

Pekin

Population 31,812

East Peoria

Population 22,485

Morton

Population 16,503

Washington

Population 15,946

Chillicothe

Population 6,185

Bartonville

Population 5,854

Peoria Heights

Population 5,834

Eureka

Population 5,095

Creve Coeur

Population 4,572

West Peoria

Population 4,246

Metamora

Population 4,094

Also in the Peoria metro: Germantown Hills (population 3,425), El Paso (population 2,871).

The communities in the grid are not suburbs of the page; they are its subject as much as Peoria is. Pekin (31,812 residents) and East Peoria (22,485) carry their own building decades, their own pipe materials and their own positions in the problem ranking's logic — a lateral under a Pekin street answers to the same data as one in the centre, but to a different era of it. Coverage here is defined by the ZIP list below; understanding is defined street by street, and this page's figures are the metro-wide version of a story each community tells in its own numbers.

Also on the Peoria map: Morton (16,503), Washington (15,946), Chillicothe (6,185), Bartonville (5,854), Peoria Heights (5,834) — communities spread across Marshall, Peoria, Stark, Tazewell, Woodford, each with housing from its own growth years. A plumber routed through PlumbReach USA to any of them is working from this same page: the metro data does not change at the city limit, but the housing on your street — its age, its materials, its soil — is what the visit is really about.

Peoria ZIP codes we cover

61369, 61375, 61421, 61424, 61426, 61449, 61451, 61479, 61483, 61491, 61516, 61517, 61523, 61525, 61526, 61528, 61529, 61530, 61533, 61534, 61535, 61536, 61537, 61539, 61540, 61541, 61545, 61546, 61547, 61548, 61550, 61552, 61554, 61559, 61561, 61562, 61564, 61565, 61568, 61569, 61570, 61571, 61602, 61603, 61604, 61605, 61606, 61607, 61610, 61611, 61614, 61615, 61616, 61625, 61721, 61725, 61729, 61733, 61734, 61738, 61742, 61747, 61755, 61759, 61760, 61771

The Peoria metro in detail

The metro's weight is not evenly spread. Peoria holds 112,126 of the 365,773 residents; Pekin and East Peoria add 31,812 and 22,485; and the remainder scatters across the smaller places above, some no bigger than a few thousand people. Plumbing follows the weight — most calls come from where most homes are — but era matters more than size: a small community of 1960s housing generates older-system work than a large new subdivision does.

Administratively the metro is drawn from Marshall, Peoria, Stark, Tazewell, Woodford — 5 in all — with Marshall County at its centre. County lines do not change pipe physics, but they do shape the paperwork around the work: permits, inspections and code details are county and city business, which is one reason the professional who serves your street is a local one.

Beyond the metro line, the nearest covered metros are Bloomington, IL (43 miles away), Springfield, IL (67 miles) and Champaign, IL (75 miles) — separate pages, separate profiles, because their housing and weather records are their own. Homeowners near the boundary sit between two datasets; the ZIP list above, not the map's edge, decides which page was written about your stock.

The region around Peoria is a set of variations on its theme: Bloomington, IL, 43 miles off, runs a median build year of 1981 on a metro population of 171,419; Springfield, IL (67 miles) medians 1973 on 206,033; Champaign, IL (75 miles) medians 1979 on 239,979. Nearness is not sameness — a few decades of median build year separate their plumbing as surely as the miles separate their maps.

Ratios tell the metro's story compactly. Renters occupy 27.1% of homes; owners hold the rest. For every home built since 2000 there are 4.8 from before 1980. Spread the stock across the coverage map and each ZIP code carries about 2,543 housing units — the density at which era patterns repeat street after street instead of scattering, and at which a routed round of calls stays inside a few districts.

The Peoria record in one line — median home age: 59 years · owner-occupied homes: 111,423 · renter-occupied homes: 41,420 · pre-1960 homes per covered ZIP code: 1,027 · heating-to-cooling degree-day ratio: 4.85 · average rainfall: 954 mm a year.

Peoria plumbing questions

Which neighbourhoods and ZIP codes does PlumbReach USA cover in Peoria?
The whole Peoria metro: 66 ZIP codes across Marshall, Peoria, Stark, Tazewell, Woodford, from Peoria through Pekin and East Peoria and every community in the grid on this page. If your ZIP code appears in the coverage list, a local plumber serving your street can be routed to you through one call. The weight of it sits where the metro does: Peoria alone holds 30.7% of the metro's residents, and the coverage follows the housing from there outward, era by era. Coverage questions come back to the same evidence: the housing counted in Marshall, Peoria, Stark, Tazewell, Woodford, the 24,668 homes built since 2000 at the edge and the older core alike — one footprint, printed in full above. The ground inside that boundary holds 167,809 housing units — 67,795 from before 1960, 51,350 from 1960-1979, 24,668 since 2000 — under the climate record kept at PEORIA GTR PEORIA AP, IL US. Stated as a list of codes: the codes run 61369, 61537, 61604, 61771 and 61611 among the 66 on the list, spread over Marshall, Peoria, Stark, Tazewell, Woodford.
What goes wrong first in Peoria homes built in the the 1960s?
Start with whatever is original. A the 1960s build in Marshall County has likely kept some of its first plumbing — and with 119,144 pre-1980 homes across the metro, plumbers here open walls on that stock every week. The tells are gradual: pressure a little weaker than last year, a drain cleared a little more often, a heater recovering a little more slowly. None of them is an emergency; together they are a timetable. In Peoria that plays out across 66 ZIP codes, from Peoria to Pekin. The same watch-list runs metro-wide: from Pekin (31,812 residents) to East Peoria (22,485) and Morton, across Marshall, Peoria, Stark, Tazewell, Woodford, the 119,144 pre-1980 homes share the materials this answer describes — which is why a neighbour's leak two streets away is worth a homeowner's attention here. The metro context is worth holding onto: 40.4% of the stock predates 1960, and the districts around Pekin and East Peoria hold much of it — your home's neighbours are ageing on the same timetable. Set against the climate that works on them — 5,614 heating degree days, 1,157 cooling degree days, 37.55 inches of rain at PEORIA GTR PEORIA AP, IL US — the era of a Peoria home is the strongest single clue to the condition of its plumbing. Where the watching happens, in figures: the community ledger reads Peoria (112,126 residents), Pekin (31,812), East Peoria (22,485), Morton (16,503) and Washington (15,946), out of 365,773 residents metro-wide — one timetable of ageing systems across all of them.
What is the most common plumbing problem in Peoria?
It is the pattern this page puts first: ageing cast iron sewer lines. Read a cast iron drain's age in its symptoms and the progression is orderly. Prevention talk usually starts there as well, because the largest single source of callouts is the one where a watched home can actually change the ending — catching the early signs costs a house call, while catching the late ones costs a floor. The backdrop is the same metro-wide: 167,809 housing units working against the PEORIA GTR PEORIA AP, IL US climate record. Homeowners near Peoria meet this pattern first; the subdivisions past East Peoria meet it later, as their stock reaches the same age — the queue is set by the building map, not by chance. Homeowners comparing notes across the metro — Peoria (112,126 residents), Pekin (31,812), East Peoria (22,485) — are comparing the same ranked list, because the ranking was run on all 66 ZIP codes at once. The inputs behind the ranking, era by era: the era ledger reads 67,795 homes before 1960, 51,350 from 1960-1979, 23,997 from 1980-1999 and 24,668 since 2000 — 167,809 units, 152,843 households, 72.9% of them owner-occupied.
What does Peoria's climate record mean for the pipes in my home?
Put a single number on it: the average year at PEORIA GTR PEORIA AP, IL US runs to about 52.7 degrees, but a plumbing system never meets the average — it meets the extremes the average is built from. 23.2 hot days drive the heater and drain load; 117.7 freezing nights test the exposed lines. A Peoria home's pipes live at both ends of that spread, every year, for as long as the house stands. The figures behind that answer, from the station record: a yearly average of 52.7 degrees, 37.55 inches of precipitation, 23.2 days at 90 or above and 117.7 nights at freezing or below — the four numbers this page's seasonal section is built from. It is the same story from Pekin to East Peoria — the stock decides, and this stock's median build year is 1967. That is the metro-wide version; the household version differs by exposure — a shaded lot in Pekin, an open slab in East Peoria (22,485 residents), a crawl space in Morton — but the loads themselves, 5,614 heating degree days against 1,157 cooling, are the same sky over every roof in Peoria. The figures are worth keeping with the house papers: 52.7 degrees as the yearly average at PEORIA GTR PEORIA AP, IL US, 37.55 inches of precipitation, and a housing stock whose median year is 1967 — the three numbers this metro's plumbing lives by. That load lands on 152,843 households across Marshall, Peoria, Stark, Tazewell, Woodford — 40.4% of their homes predate 1960, a median build year of 1967 — which is why the climate section of this page is arithmetic, not atmosphere. Whose roofs that weather works on: the community ledger reads Peoria (112,126 residents), Pekin (31,812), East Peoria (22,485), Morton (16,503) and Washington (15,946), out of 365,773 residents metro-wide.
A pipe just burst at my Peoria house — what are the first three things to do?
Do not hunt for the leak; hunt for the valve. While water is moving, its source matters less than its supply. The shutoff for most Peoria homes is at the meter by the street or where the main line enters the building — close it and the emergency becomes a mess instead of a disaster. Then drain the system from its bottom tap, keep feet and hands away from any socket or appliance the water has reached, and call with the damage already stopped. Across the metro's 5 counties, Marshall County included, the pattern repeats wherever the housing matches. The local detail that decides how the first minutes go: which side of Peoria the home sits on. Houses in Pekin and the older districts tend to shut off at an interior valve; slab homes out toward East Peoria and Morton more often at the meter — worth knowing before the water is moving, across all 66 covered ZIP codes. The calm-day homework for this metro: walk the 66 covered ZIP codes' worth of housing in your mind to your own valve — in Marshall County the older stock hides it indoors, the slab tracts past East Peoria at the meter — and turn it once before you ever need it in anger. The calm-day version, localised: find your valve before PEORIA GTR PEORIA AP, IL US's next freeze season — 117.7 freezing nights a year — whether your home sits near Peoria, out in Pekin (31,812 residents) or past East Peoria (22,485). True from the centre to the edge: the community ledger reads Peoria (112,126 residents), Pekin (31,812), East Peoria (22,485), Morton (16,503) and Washington (15,946), out of 365,773 residents metro-wide — shutoff first, everywhere on the map. For the record of the call: the Peoria metro, 365,773 residents, 72.9% of its homes owner-occupied, a median build year of 1967. Learn it street by street if you must: the 61771 subdivisions shut off at the meter, the 61611 districts at the wall, the oldest homes out toward 61421 at a curb stop — the map of valves is the map of build decades.
How many leaks in a Peoria house mean the pipes themselves are done?
Think of it as a count with a trend. Leak one: repair it and note the material. Leak two, same material, different room: the system has started a pattern. Leak three, with pressure sagging at every tap: repairs are now renting time in a house that needs its lines renewed. The metro's pre-1980 share — 71.0% of homes — means Peoria plumbers hold this conversation weekly, and the honest ones hold it at leak two, not leak five. Homeowners in Pekin (31,812) and East Peoria (22,485) read this page for the same reason — the stock there is the same stock. Drive it in any direction — out to Morton, back through Pekin — and the eras change but the materials story does not. The pattern is not evenly spread: it concentrates in the 119,144 pre-1980 homes, thickest in the founding districts and the first suburbs — the streets around Pekin and the old core — and thins toward Morton and the growth edge, where the stock is a generation younger. The evidence standard is the same across Marshall, Peoria, Stark, Tazewell, Woodford: in the 67,795 pre-1960 homes the bore of a cut section settles it; in the 1960-1979 ring — 51,350 homes — the sequence of leaks settles it. Streets carry the same ledger at household scale: from Peoria (112,126 residents) through Pekin (31,812) to East Peoria (22,485), the leak sequence means the same thing wherever the material matches. Where the conversations happen: the community ledger reads Peoria (112,126 residents), Pekin (31,812), East Peoria (22,485), Morton (16,503) and Washington (15,946), out of 365,773 residents metro-wide, earliest and oftenest in the founding names on that list.
Am I hiring PlumbReach USA, or a local Peoria plumber?
An independent local plumber — not a PlumbReach USA employee. We run the connection service and the call center hours listed on this page; the professional who serves Peoria runs their own business, sets their own schedule with you, and does the work. We think that arrangement works well when it is stated plainly, so we state it on every page. The local figures behind it: 119,144 homes from before 1980 and 24,668 built since 2000, sharing one system of streets and soil. From Pekin to Morton, the model does not change: PlumbReach USA publishes the homework — this page, built from Peoria's Census and NOAA records — and routes the call; the independent professional who serves that part of Marshall, Peoria, Stark, Tazewell, Woodford does everything at the home. The same plain statement covers the whole metro, from the core around Peoria to the edge past East Peoria: information and routing from us, the work and everything that follows from it from the independent professional you hire. Callers from Pekin (31,812 residents), East Peoria (22,485) and Morton get the same plain arrangement: our routing, their plumber, their terms — stated here because the metro's 365,773 residents deserve it stated. The arrangement holds in every community: the community ledger reads Peoria (112,126 residents), Pekin (31,812), East Peoria (22,485), Morton (16,503) and Washington (15,946), out of 365,773 residents metro-wide.
What plumbing checks are worth doing each year in Peoria?
Five habits, matched to the record at PEORIA GTR PEORIA AP, IL US. Test the main shutoff until it turns without argument. Give the water heater its yearly drain-down against the sediment Peoria's demand settles into it. Read the meter on a still evening. Run the ground-floor drains so their traps stay full. And walk the exposed lines before the 117.7 freezing nights arrive. Ordinary work, done in the order this metro's climate and housing age make valuable. None of it is abstract at this scale: 152,843 households across Marshall, Peoria, Stark, Tazewell, Woodford share one climate and one ageing stock, so a yearly rhythm kept by even a fraction of them is the difference between this metro's plumbing failing in private, one house at a time, and failing on a schedule somebody saw coming. The checks travel well because the conditions do: PEORIA GTR PEORIA AP, IL US's record covers Pekin, East Peoria and Morton alike, and the housing eras repeat across all 66 ZIP codes. A neighbour in another district keeping the same calendar is not copying you; they are reading the same data. The calendar's local proof is in the stock figures: 119,144 pre-1980 homes to keep valves alive in, 24,668 post-2000 homes reaching first-fixture age together, and 37.55 inches of rain a year testing every cleanout in Marshall, Peoria, Stark, Tazewell, Woodford. The checks are sized to the stock's actual eras — a median build year of 1967, 40.4% of it pre-1960 — not to a generic house that exists nowhere in Peoria. The routine's stock, counted: the era ledger reads 67,795 homes before 1960, 51,350 from 1960-1979, 23,997 from 1980-1999 and 24,668 since 2000 — 167,809 units, 152,843 households, 72.9% of them owner-occupied.
Why does this page lead with the problems it leads with in Peoria?
By scoring, from two public records. The Census housing data says what Peoria's homes are made of and when they were built; the NOAA climate record says what the weather loads onto them. Patterns that both records support rank highest, and the evidence paragraphs in each section show the working. Nothing in the order comes from a national template — the template is the scoring, and the scores are Peoria's alone. The ranking's geography is visible in the coverage grid: the patterns at the top of the list concentrate where the old stock does — the core around Peoria, the first suburbs toward Pekin — while the growth communities past East Peoria (22,485 residents) pull the ranking's lower half upward year by year. The sort is re-run from the data, not inherited: 40.4% pre-1960 stock, 71.0% pre-1980, 23.2 hot days against 117.7 freezing nights — the weights are this metro's, so the ranking is. The evidence trail is on this page: the problem sections scored pattern by pattern, the housing profile drawn from Marshall, Peoria, Stark, Tazewell, Woodford, the climate read from PEORIA GTR PEORIA AP, IL US — the ranking is the two records read together, nothing else. The scoring's raw material, community by community: the community ledger reads Peoria (112,126 residents), Pekin (31,812), East Peoria (22,485), Morton (16,503) and Washington (15,946), out of 365,773 residents metro-wide. Run the identical scoring next door and the order shifts: Bloomington, IL, 43 miles away, keeps its own list; Springfield, IL, 67 miles, another; Champaign, IL, 75 miles, a third — proximity is not sameness. The sort ran over the whole list — from 61369 and 61537 through 61604, 61771 and 61611 to 61421 — and returned one order for all of it, because the inputs were the metro's totals, not any single district's.
Which Peoria neighbourhoods sit on the metro's oldest pipes?
The founding districts, and the map proves it street by street. Around the old centre of Peoria the housing predates modern pipe materials almost entire — 67,795 pre-1960 homes across the metro, concentrated in that core and its first suburbs. It matters because those streets hold the systems nearest the end of their design lives: the drains, supplies and laterals this page's problem list is largely about. It is also a numbers story: of Peoria's 167,809 housing units, the pre-1960 share is 40.4% — the largest single concentration of original-era pipework in the metro, sitting in the districts where Marshall County's streets were laid out first. Concentrations, for the record: the oldest systems sit inside the 67,795 pre-1960 homes, and those homes cluster — the founding core, the streetcar-era streets, the first suburbs in Marshall County — rather than scattering evenly across the 66 covered ZIP codes. It is why two homes a mile apart in Peoria can need different conversations: one on the 1960s materials near the centre, one on modern lines past East Peoria — the map of eras is the first diagnostic. ZIP by ZIP the same gradient: the oldest systems cluster in the codes nearest the centre — the 61369 side of the list — and the youngest toward 61771 at the edge, across Marshall, Peoria, Stark, Tazewell, Woodford. The map's communities in growth order: the community ledger reads Peoria (112,126 residents), Pekin (31,812), East Peoria (22,485), Morton (16,503) and Washington (15,946), out of 365,773 residents metro-wide. Counted under its Census name — the Peoria metro, 365,773 residents, 72.9% owner-occupied — the oldest layer is a defined population of homes, not a figure of speech.
What should a yearly plumbing check in Peoria actually include?
By frequency in this metro: a shutoff that resists, first — in the 119,144 pre-1980 homes it is the single commonest finding. Then heater sediment, in a climate that works tanks through 23.2 hot days a year. Then a meter that moves at rest, reporting on a buried or hidden line. Then the ground-floor drains, slowest of the set. Everything else a check finds in Peoria is commentary on those four. Scale the walk to the metro and its importance grows: 152,843 households, a median build year of 1967, 37.55 inches of rain a year pressing on the buried half of every system. The check is thirty minutes in one home; multiplied across a stock like this, it is the difference between the metro's failures arriving as surprises and arriving as appointments. Across 66 ZIP codes the half hour repeats with the same shortlist and different evidence: a stock of 167,809 homes, 119,144 of them pre-1980, under a record of 5,614 heating degree days — the check reads those numbers home by home. Keep the findings with the house records: in a metro of 152,843 households, the homes whose owners can date their last check are the ones whose failures arrive as appointments — the entire point of the half hour. The walk, scaled: 167,809 homes, 119,144 of them pre-1980, a median year of 1967, a climate of 5,614 heating degree days and 37.55 inches of rain at PEORIA GTR PEORIA AP, IL US — the shortlist is those numbers, interviewed one house at a time. The walk's territory, in codes: the codes run 61369, 61537, 61604, 61771 and 61611 among the 66 on the list, spread over Marshall, Peoria, Stark, Tazewell, Woodford.

Before an emergency, read the guide: How to shut off your home's water main

Nearby metro areas

Need a plumber in Peoria?

Describe the problem and the call center routes you to an independent local plumber who works in the Peoria metro.

Call center hours: Mon-Fri 7:00 AM-10:00 PM ET | Sat 8:00 AM-10:00 PM ET | Sun 7:00 AM-9:00 PM ET

Call Now
