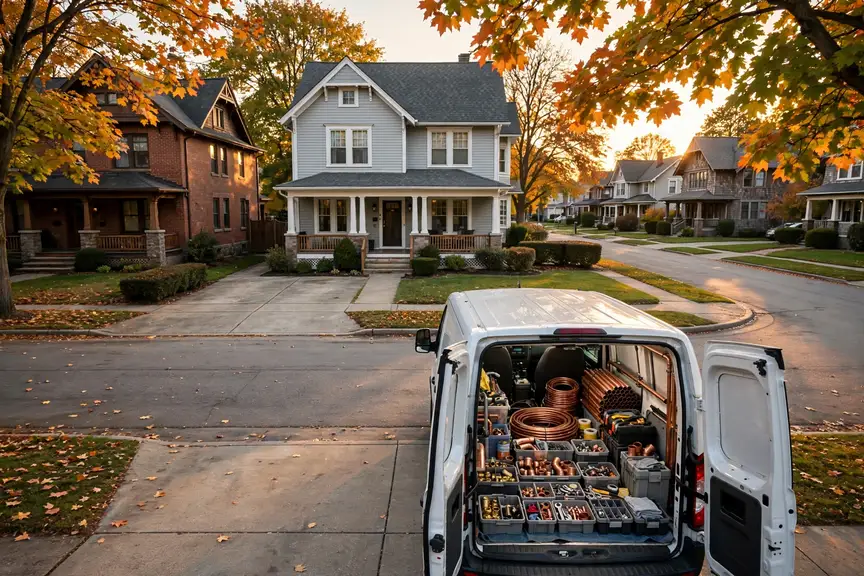


Everything on this page was computed for Janesville and nowhere else: the problem ranking from its Census housing profile, the seasonal risks from its NOAA station record, the coverage from its own ZIP codes. PlumbReach USA connects you to an independent local plumber; the page itself is the homework, done in public, so the call you make is an informed one.
Call center hours: Mon-Fri 7:00 AM-10:00 PM ET | Sat 8:00 AM-10:00 PM ET | Sun 7:00 AM-9:00 PM ET
The median Janesville home was built in 1970; 65.8% of the stock predates 1980, and the pattern this metro's own data ranks first is ageing cast iron sewer lines. PlumbReach USA is a referral service, not a plumbing company: one call connects you with an independent local plumber serving your ZIP code.
Start with the raw material: 163,944 people, 70,694 housing units, and a housing stock whose middle home was built in 1970. That single date organises everything on this page. On one side of it stand the older districts — 37.3% of homes predate 1960, 65.8% predate 1980 — plumbed in galvanized steel, cast iron and clay, in homes across Rock that have been repaired piecemeal for decades. On the other side, the 14.8% built since 2000 run plastic lines under slabs, and fail in the newer ways. A Janesville plumber reads a home's build year the way a doctor reads a chart: it predicts, before a single wall is opened, which systems deserve suspicion first.
Ask how Janesville's older homes have been kept and the honest answer is: in pieces. A water heater here, a repipe there, one bathroom renewed while the rest of the system carries on — across 46,517 pre-1980 homes, the patchwork is the norm rather than the exception. That history is written in the walls of Rock County and everywhere else the early stock stands: systems that are part original, part renewed, and entirely individual. It is also why the guidance on this page keeps returning to patterns rather than single faults — in a patchwork system, the pattern is the diagnosis.
Uniformity is the newer stock's defining trait. A subdivision in Edgerton or Evansville went up in a handful of years, fitted with one generation of fixtures, one heater model class, one approach to running lines under slabs. That uniformity writes a calendar the whole street shares: the first heater wave, the first cartridge wave, the first questions about lines under concrete arrive together, years before the same streets need anything structural. With 14.8% of the metro built since 2000, that calendar governs a large and growing share of Janesville's plumbing work — predictable work, if a household reads the calendar early.
The weather's part in this is written at ROCKFORD GTR ROCKFORD AP, IL US, where an average year carries 37.24 inches of precipitation, 14.8 days at ninety degrees or more and 135.8 nights at freezing or below. Pipes experience that year as workload and as hazard in roughly equal measure — the workload in the heater's cycle count and the drains' burden, the hazard in the exposed runs and the swelling soil. The problem ranking further down is simply the housing profile above, read under this sky.
Two public records, one metro: what was built here, and what the sky does to it.
Break the stock down by building era and the profile sharpens. Before 1960: 37.3% of homes, roughly 26,369 of them. From 1960 to 1979: 28.5%, about 20,148. From 1980 to 1999: 19.4%, about 13,715. Since 2000: 14.8%, about 10,463. Four eras, four material palettes — and the balance among them is this metro's plumbing character in a single paragraph.
Some metros are defined by their growth; this one is defined by its inheritance. The largest share of Janesville's homes was built before 1960, and inheritance in plumbing means materials at the end of their design lives serving households who did not choose them. The work that follows from that fact is the metro's staple: drains renewed, supplies renewed, laterals renewed — the patient, house-by-house replacement of a founding stock. Newer districts exist and matter, but they are not where this metro's plumbing character was decided.
Close behind the leader come the 1960-1979 homes, 28.5% of the stock. Their plumbing is mid-change by construction — the decades when materials swapped over mid-stream — so this band is where a Janesville plumber earns the diagnostic fee: pressure tests and camera runs that say which side of the transition a given house was built on.
A profile needs its climate column, and Janesville's comes from ROCKFORD GTR ROCKFORD AP, IL US: an average year of 49.4 degrees, built from extremes at both ends. The heating load (6,497 degree days) and the cooling load (838) together set the water heater's working life; the precipitation total (37.24 inches) sets the soil's behaviour around every buried line; the freeze count (135.8 nights) sets the exposure of every uninsulated run. Four numbers — and most of the metro's plumbing behaviour follows from them.
That is the whole method of this page in one section: era shares from the Census, loads from NOAA, and a problem list that is simply where the two overlap most in Janesville. The services and guidance that follow are ordered by the same profile — local first, generic last.
Chosen by this metro's own housing and weather data — the same two records this whole page is built from.
Read a cast iron drain's age in its symptoms and the progression is orderly. First the line slows — not blocked, just reluctant, as scale roughens the bore and catches what passes. Then the complaints localise: one branch backing up, then another, as sections of the run reach their own stages of narrowing. In Janesville's oldest districts that progression plays out across whole streets of the 1970s housing at once, because the lines were laid in the same years from the same material. The camera distinguishes the stages house by house: a bore narrowed by scale that cleaning can restore, against a wall thinned and cracked past any cleaning's help.
The pipe itself explains the timeline. Cast iron drains by gravity, slowly, and everything a household sends down it — grease films, mineral-heavy water, the occasional corrosive cleaner — works on the iron for decades. The metal does not fail evenly: it thins first at the bottom of horizontal runs, where water and grit sit longest, and at the joints where sections meet. That is why two Janesville homes of the same age can be in different places with the same pipe: usage, water chemistry and soil conditions around the line all vote on how fast it goes. What a camera inspection adds is certainty — the difference between a line that needs cleaning, a line that needs a section replaced, and a line living on borrowed time.
Count it from the Census side: 26,369 homes in this metro predate 1960, and the drain lines beneath them were cast in an era that assumed a working life now fully spent. They will not all fail at once — they will fail one street at a time, in the order the corrosion reaches, which is what makes the pattern a ranking on this page rather than a footnote.
There is a diagnostic shortcut for galvanized systems, and it is a white bucket. Fill it at a tap after the house has sat quiet overnight: the first draw runs tea-coloured with the rust the lines have shed, clearing as fresh water arrives. It is a small experiment with a large meaning — the pipe's interior is dissolving into the water it carries. Across Janesville, homes plumbed in the galvanized decades run that experiment daily whether they look at the bucket or not. One home's result is a curiosity; the same result with falling pressure and returning leaks is the material's resignation letter.
Galvanized pipe fails politely, which is exactly the problem — it gives a household years of small warnings that are easy to live with. The zinc coating that once protected the steel wears through, rust takes its place, and the rust grows inward like a narrowing artery. Flow to the farthest fixtures drops first. A shower that shares a line with a running tap loses its pressure. By the time the water itself runs discoloured after the house has sat quiet overnight, the narrowing is well advanced. None of this is a single emergency; it is a system reaching the end of its design life on schedule, and in Janesville's pre-1980 neighbourhoods that schedule is arriving for whole streets at once, because the pipes went in together.
In raw numbers, Janesville's exposure is 46,517 homes built before 1980 — the galvanized decades. Behind every one of those front doors is the same material on the same clock, which is why pressure complaints and pinhole leaks cluster by neighbourhood here rather than scattering evenly across the metro.
Water expands when it freezes, and a closed pipe gives that expansion nowhere honourable to go. The split usually forms where the ice plug's pressure peaks — often not where the freeze itself sits — which is why a burst can hide in a warm stretch of wall downstream of the frozen one. Janesville's exposure concentrates where lines leave the heated envelope: the pre-1980 districts around Janesville, garages, crawl spaces, additions. On the coldest nights of the year, the metro's plumbing is only as strong as its least-protected run, and the thaw reads out the verdict house by house.
A burst pipe is rarely about the coldest night of the year; it is about the one unprotected run of pipe the cold can reach. Water expands as it freezes, and the pressure that splits a line is not the ice itself but the water trapped between the ice blockage and a closed tap. Lines in exterior walls, unheated crawl spaces, garages and hose bibbs are the usual victims — the places where a home's heating never quite arrives. Janesville's older housing carries more of these runs than its newer builds, which route water through conditioned space by design. The thaw is when the damage shows: the split may weep for hours before anyone is home to hear it, which is why the shutoff advice on this page matters more than any repair.
Janesville's freeze maths is unforgiving: 135.8 sub-freezing nights in an average year at ROCKFORD GTR ROCKFORD AP, IL US, multiplied by every uninsulated run in every older home, gives the season hundreds of chances to find one weak line. The splits favour the same addresses winter after winter — the the 1970s stock with pipes in the cold zones of the house.
This is the season the metro's housing stock is examined by the weather, and the examination is practical: every exposed run, every unheated void, every shutoff nobody has tested. The failures arrive in batches behind the hardest nights and announce themselves at the thaw. The rest of the season grades the slower systems too — heaters working against the coldest incoming water of the year, laterals under frozen ground — but the headline the season writes, year after year, is the sound of water in a wall that should be dry.
Winter's load on this metro can be counted two ways: in the 135.8 freezing nights ROCKFORD GTR ROCKFORD AP, IL US records, and in the age of the housing that must withstand them — half of it built by 1970 or earlier. Neither number alone predicts a burst; multiplied together, they predict a season. Local plumbers plan their winter around that product, and households in the older districts do well to plan their autumn the same way.
There is a reason this pattern tops so many old-metro lists, and Janesville holds the reason in bulk: iron was simply what drains were, for the whole first age of indoor plumbing. Every pre-1960 home still on its original line — and the Census counts 26,369 pre-1960 homes here — is running an experiment in how long buried iron can serve. The results arrive unevenly: one street's lines camera clean and sound, the next street's flaked to lace. That unevenness is why the deep-dive ends in a camera rather than a conclusion, and why two neighbours with identical houses can honestly need different work.
The numbers underneath it, for Janesville: 70,694 housing units, a median build year of 1970, and a climate record at ROCKFORD GTR ROCKFORD AP, IL US of 6,497 heating degree days against 838 cooling degree days. Cross the housing record with the weather record and this pattern is what falls out at the top — rarely the most dramatic problem in plumbing, but the one this metro's stock and climate manufacture most steadily.
On a first visit for this pattern, a local plumber's checks run in a practised order:
Sequenced by this metro's own problem ranking, not by a national catalogue order.
The sewer line is the one pipe every fixture in the house shares, and the only one whose failure backs up into the home instead of draining away from it. Its enemies are time, roots and soil movement, working at the pace of decades. Service on the line begins with evidence — camera footage of its actual condition — because the difference between a cleaning, a sectional repair and a replacement is written inside the pipe, not in the symptom at the drain.
Put the metro's laterals end to end and they would run for thousands of miles — one private road per home, most of them laid generations ago and none of them inspected since. Janesville's share of that buried network follows its building history: clay and iron under the founding districts, transitional materials in the post-war ring, plastic in the growth corridors around Edgerton. Sewer service here is the slow audit of that network, one camera run at a time, and its findings sort themselves by era so reliably that the footage often confirms the street's building date before it confirms anything else. From Edgerton to Evansville, the pattern repeats wherever the housing era matches.
Sewer demand follows the founding map: the districts built first, around the old centre and out through Edgerton, hold the jointed clay and iron; the growth rings hold plastic with decades in hand. 37.3% of the metro's homes stand on the founding side of that line, which is why the footage here so often shows a pipe at the end of its story.
One leak is an event; three in a year is a verdict. Pipe work weighs that pattern — the metal's age, the water's behaviour, the repair history — and either fixes the section in front of it or proposes the honest larger job: a whole-house repipe that ends the rhythm for good.
A repipe decision in Janesville is usually made at a kitchen table, from three exhibits: the water's behaviour at the taps, the count of repairs already paid for, and the material visible wherever the system shows itself. Exhibits like those persuade because they are the household's own. The work itself, when it comes, is less disruptive than its reputation — modern lines route through attics, closets and chases, water stays on for most of the project, and the plaster sacrificed is measured in patches, not rooms. What the household buys back is the thing the old material had been taxing away: pressure, clarity, and the right to forget the pipes exist. It is why two Janesville homes of the same age, on different streets, so often need the same visit in the same year.
Pipe work divides by era in this metro with unusual neatness: renewal conversations in the 46,517 pre-1980 homes, sectional repairs in the middle ring, and near-silence from the 10,463 post-2000 homes whose lines are still young. A call from Milton can sit in any of the three bands; the home's build year says which before the door opens.
In a metro of 70,694 homes with a median build year of 1970, water heaters fail in waves as whole streets age together — the plumbers serving Rock stock and schedule for exactly that pattern.
In Janesville the emergency call is routed, not queued: one number reaches the independent local plumber covering Rock at that hour, and the housing record on this page — median build year 1970 — is the homework they arrive already knowing.
Drain work in Janesville splits by era: the 46,517 pre-1980 homes drain through older materials, the post-2000 subdivisions through plastic — and the local plumber reads the cable's return to tell which world your street drains through.
Leak detection in Janesville is instrument work over local knowledge: acoustic and thermal tools, aimed first at the districts this page's data flags — the pre-1980 stock and the slab tracts out toward Evansville.
Running, rocking or refusing — in Janesville the diagnosis is the same short sequence: fill valve, flapper, supply line, flange. The plumbers routed here carry the internals for the fixtures this metro's eras installed.
Fixture work in Janesville divides by era like everything else on this page: washer-era taps in the older districts, cartridge internals in the post-2000 subdivisions — the local plumber stocks for both.
If this page's services were ranked by Janesville's call patterns rather than listed in catalogue order, they would come out much as they do here — because the ranking behind them is data, not habit. Ageing cast iron sewer lines leads the metro's problem table and galvanized pipes at the end of their life follows, so the services answering them lead the list. The long tail of a metro's plumbing life — fixture failures, toilet calls, the single unexplained leak — fills in the diary around them, here as everywhere.
 PROBLEM
 SOLUTION
Population 65,813
Population 5,924
Population 5,771
Population 5,685
Population 3,205
Population 2,034
Population 1,567
Population 876
Population 143
Population 141
Population 52
A metro is a federation of building decades wearing one name, and the grid above is Janesville's federation: Janesville at the centre, Edgerton (5,924 residents) and Evansville (5,771) in the next ring, and the smaller communities beyond, down to places a few thousand households deep. What unites them is one climate record and one routing; what divides them is the year their streets were plumbed. The ZIP list that follows is the practical definition of that federation — if your code is on it, your home's era is part of the data this page was built from.
Beyond the largest communities sit Milton (5,685), Brodhead (3,205), Clinton (2,034), Orfordville (1,567), Footville (876) — smaller places across Rock, covered on the same terms. Their housing tends to be older on average than the big suburbs', and their calls follow the older patterns on this page. One routing covers them all: find your ZIP code below and the rest is a phone call.
Every metro has a first city and a supporting cast, and the census figures draw the billing plainly here: Janesville first, with 65,813 residents; Edgerton second at 5,924; Evansville third at 5,771; then the long tail of smaller communities in the grid above. The billing matters less than the building dates — each of these places was plumbed in its own decade, by its own builders — but between them they account for nearly every housing era, material and failure pattern this page describes.
Administratively the metro is drawn from Rock — 1 in all — with Rock County at its centre. County lines do not change pipe physics, but they do shape the paperwork around the work: permits, inspections and code details are county and city business, which is one reason the professional who serves your street is a local one.
Three neighbouring coverage areas begin where this one ends: Madison, WI, some 38 miles off; Kenosha, WI, 61 miles; and Milwaukee, WI, 63 miles. Each keeps its own page because each keeps its own numbers — a different median build year, a different climate station, a different problem ranking. Boundary households should trust the ZIP list over the map: the code, not the compass, assigns the dataset.
The region around Janesville is a set of variations on its theme: Madison, WI, 38 miles off, runs a median build year of 1983 on a metro population of 709,685; Kenosha, WI (61 miles) medians 1975 on 168,448; Milwaukee, WI (63 miles) medians 1966 on 1,575,010. Nearness is not sameness — a few decades of median build year separate their plumbing as surely as the miles separate their maps.
Divide the stock by the map and the densities appear: roughly 5,438 housing units for every covered ZIP code, 66,652 households to a county, 11 named communities in the grid. The balance between the generations reads 4.4 pre-1980 homes for every home built since 2000 — a single ratio that quietly predicts whether a metro's plumbing week leans toward renewal work in the old districts or first-generation upkeep in the new ones.
The Janesville record in one line — median home age: 56 years · owner-occupied homes: 47,056 · renter-occupied homes: 19,596 · pre-1960 homes per covered ZIP code: 2,028 · heating-to-cooling degree-day ratio: 7.75 · average rainfall: 946 mm a year.
Before an emergency, read the guide: How to shut off your home's water main
PlumbReach USA routes your call to an independent local plumbing professional serving Janesville — the assessment and the work are theirs.
Call center hours: Mon-Fri 7:00 AM-10:00 PM ET | Sat 8:00 AM-10:00 PM ET | Sun 7:00 AM-9:00 PM ET