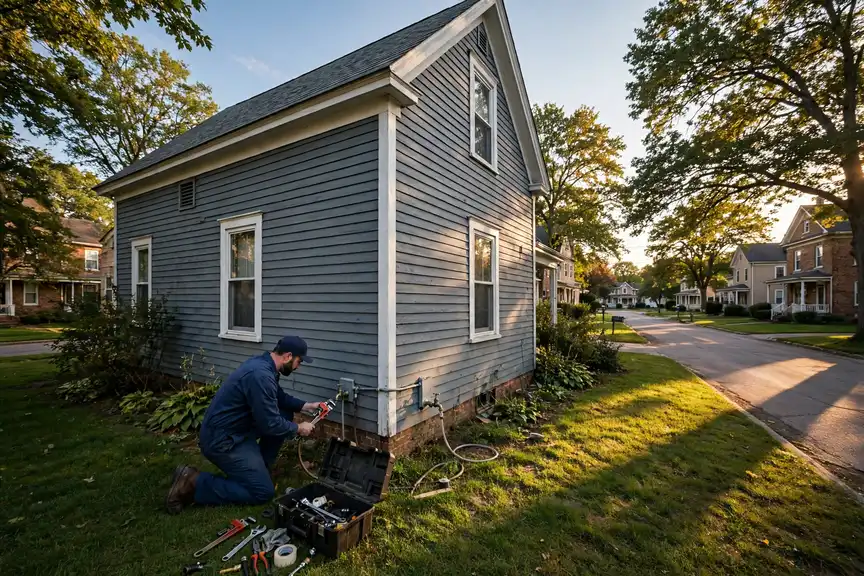


A metro's plumbing is a portrait of its building history under its weather, and Fort Wayne's portrait is painted below from its own records: Census housing figures, NOAA climate normals, the metro's ZIP codes and communities. PlumbReach USA's role is the connection to a local professional; the portrait is here so that connection starts from understanding rather than urgency.
Call center hours: Mon-Fri 7:00 AM-10:00 PM ET | Sat 8:00 AM-10:00 PM ET | Sun 7:00 AM-9:00 PM ET
The median Fort Wayne home was built in 1976; 56.2% of the stock predates 1980, and the pattern this metro's own data ranks first is ageing cast iron sewer lines. PlumbReach USA is a referral service, not a plumbing company: one call connects you with an independent local plumber serving your ZIP code.
The stock, in one pass: 451,440 residents, 191,399 housing units, 179,472 households — and a build history that splits the metro into plumbers' generations. 29.2% of homes stand from before 1960; 56.2% from before 1980; the rest divide between the late-century suburbs and the 20.1% built since 2000. Every era is a materials decision still in force: the pipes in a Fort Wayne wall are the ones its decade specified, ageing on that decade's schedule, whatever the current owner's plans for them.
The pre-1980 districts are not a museum; they are most of the metro's working housing, and their plumbing is a patchwork in the literal sense — original runs beside renewed sections, a heater of one decade feeding fixtures of another. Across 107,566 such homes in Allen, Wells, Whitley, no two systems share exactly the same repair history, which is why the guidance below insists on pattern over incident: in patchwork plumbing, what has already been replaced is as diagnostic as what has failed.
The growth side of the metro tells the opposite story in the same language. New Haven, Huntertown and the subdivisions still filling in account for much of the 38,471 homes built since 2000 — plastic supply lines, plastic drains, cartridge fixtures, slab foundations. Their plumbing is not old; it is uniform, which creates its own calendar: everything installed in the same boom reaches each wear point in the same years, from the first water-heater replacements to the first slab-leak scares, while 849 cooling degree days of annual heat keep demand on the system high.
The weather's part in this is written at FT WAYNE INTL AP, IN US, where an average year carries 39.48 inches of precipitation, 15.7 days at ninety degrees or more and 123.6 nights at freezing or below. Pipes experience that year as workload and as hazard in roughly equal measure — the workload in the heater's cycle count and the drains' burden, the hazard in the exposed runs and the swelling soil. The problem ranking further down is simply the housing profile above, read under this sky.
The metro's building eras on one side, its weather record on the other — and its plumbing where the two meet.
The distribution, in one breath: of every hundred Fort Wayne homes, 29.2 were standing before 1960, 27.0 went up in the two decades after, 23.7 in the two after that, and 20.1 have arrived since 2000. Percentages flatten the picture, so hold the counts beside them — 55,889 oldest-era homes, 38,471 newest — and the metro's plumbing stops being an abstraction: it is that many systems, of those ages, failing in that order.
This is, by the numbers, an old-system metro. The largest slice of its housing predates 1960, which means the typical serious job here involves materials in their seventh decade or beyond: drains of cast iron or clay, supply runs in galvanized steel, laterals laid when the streets themselves were young. The newer bands exist — the growth since 2000 is real — but they are the supporting cast. Fort Wayne's plumbing identity was fixed by its earliest builders, and its problem list is written in their materials.
Close behind the leader come the 1960-1979 homes, 27.0% of the stock. Their plumbing is mid-change by construction — the decades when materials swapped over mid-stream — so this band is where a Fort Wayne plumber earns the diagnostic fee: pressure tests and camera runs that say which side of the transition a given house was built on.
No profile of this metro is complete without its extremes, because plumbing meets the extremes, not the averages. The average year at FT WAYNE INTL AP, IN US — 50.9 degrees, 39.48 inches of precipitation — is a statistical resident of a metro nobody lives in. The lived version is the coldest night of January against an uninsulated run, the storm week that saturates the soil over every lateral, the August stretch that works heaters and drains without a pause. The numbers in this section are the averages; the problems ranked below are the extremes, translated.
A profile is only useful if it predicts something, and this one predicts the shape of a plumbing diary in Fort Wayne: which streets will call about drains, which about pressure, which about heaters, and in which months. Everything after this section is that prediction written out as services, problems and answers — the numbers first, the narrative second, the way the evidence actually runs.
Ordered by what this metro's data says its homes need most.
The sewer line is the one pipe every other pipe depends on. When it bellies, cracks or fills with roots, the whole house feels it through its ground-floor fixtures. Repair ranges from sectional fixes through a cleanout to full replacement, chosen from camera footage rather than guesswork.
Every home in Fort Wayne drains to one line, and that line's condition is written in the metro's housing data: a median build year of 1976 means half the metro's laterals have been buried for decades, ageing in step with the houses above them. In the newer areas — 20.1% of homes built since 2000 — the pipe is plastic and the problems are different: bellies where bedding settled, construction debris, a joint shifted by soil movement. The camera inspection is the same either way, and it is what sizes the job: spot repair, partial replacement, or the full run, each with footage to justify it. It is why two Fort Wayne homes of the same age, on different streets, so often need the same visit in the same year.
Under Fort Wayne lie 191,399 laterals, one per housing unit, and the oldest of them — beneath the 55,889 pre-1960 homes — have been underground since the metro was a fraction of its present size. The camera diary in New Haven and the old core is written by that buried generation.
The supply system is a single organism, so its failures correlate. Repiping exists for the point where correlation is obvious: pressure fading, water discolouring, leaks touring the house. New runs go in PEX or copper, routed to minimise opening walls, pressure-tested before anything is closed up.
Repiping reads as a dramatic word for what is, in Fort Wayne's older districts, a routine chapter of homeownership — the point where a material that served two generations hands over to one that will serve the next two. The metro's figures say how routine: 56.2% of homes predate 1980, and every one of them is running supply lines from a shorter-lived era. The households that handle the chapter well treat it as scheduling rather than crisis: evidence gathered, routes planned through the accessible spaces, water staged back on room by room. What they retire is not just pipe but a pattern of small failures. With a median build year of 1976, most of the metro's 191,399 housing units are working through the same ageing curve.
The repair-or-renew caseload is set by one figure above the rest: 56.2% of Fort Wayne homes predate 1980, plumbed in the materials now at the end of their service lives. Around Bluffton (10,539 residents) as in the old core, that percentage is not an abstraction — it is the street's plumbing, house by house.
In a metro of 191,399 homes with a median build year of 1976, water heaters fail in waves as whole streets age together — the plumbers serving Allen, Wells, Whitley stock and schedule for exactly that pattern.
One call from anywhere in the Fort Wayne metro — from Fort Wayne out to Bluffton — routes to the local professional on cover; the failure patterns they expect first are the ones this page's data ranks.
Across Allen, Wells, Whitley, drain calls follow the building map: iron and clay near the old core around Fort Wayne, plastic at the growth edge — one service, two different crafts, both covered by the routing on this page.
A creeping meter in a Fort Wayne home is located, not guessed at: the professionals routed here trace the line with instruments and confirm the spot before any floor or wall is opened.
Toilet calls in Fort Wayne are the small end of the diary and the most democratic: every era of the 191,399-home stock produces them, and the local fix starts with the mechanism in the tank, not the porcelain.
Drips and disposals across Allen, Wells, Whitley are small jobs with a standard: repair the mechanism where the fixture deserves it, renew it where it does not, and check the shutoffs and supply lines while the cabinet is open.
Bookings in this metro have a centre of gravity, and it sits on the two patterns this page ranks first: Ageing cast iron sewer lines, then galvanized pipes at the end of their life. Everything a local service operation does — the vans' stock, the week's scheduling, the order of this very list — bends around that gravity. A homeowner reading the services above is therefore reading something more specific than a menu: a forecast of what a home like theirs, in a metro built like this one, is most likely to need, in the order it is most likely to need it.
Ranked for this metro alone, from its Census housing profile and NOAA climate record.
Read a cast iron drain's age in its symptoms and the progression is orderly. First the line slows — not blocked, just reluctant, as scale roughens the bore and catches what passes. Then the complaints localise: one branch backing up, then another, as sections of the run reach their own stages of narrowing. In Fort Wayne's oldest districts that progression plays out across whole streets of the 1970s housing at once, because the lines were laid in the same years from the same material. The camera distinguishes the stages house by house: a bore narrowed by scale that cleaning can restore, against a wall thinned and cracked past any cleaning's help.
The pipe itself explains the timeline. Cast iron drains by gravity, slowly, and everything a household sends down it — grease films, mineral-heavy water, the occasional corrosive cleaner — works on the iron for decades. The metal does not fail evenly: it thins first at the bottom of horizontal runs, where water and grit sit longest, and at the joints where sections meet. That is why two Fort Wayne homes of the same age can be in different places with the same pipe: usage, water chemistry and soil conditions around the line all vote on how fast it goes. What a camera inspection adds is certainty — the difference between a line that needs cleaning, a line that needs a section replaced, and a line living on borrowed time.
The local weight of it: 55,889 homes in this metro predate 1960, and while some have renewed their drains since, every original line still serving is past the age its installers planned for. That is a population of risk no single street explains — it is the metro's founding stock, failing on a schedule set in the post-war decades.
The galvanized story can be told at a single tap. Open the fixture farthest from the meter in a Fort Wayne home still on its original steel and watch the stream: respectable for a moment, then thinning as the narrowed runs upstream ration the flow. That rationing is the material's old age made visible — decades of internal rust taxing every gallon. The metro holds 107,566 pre-1980 homes, and in the ones never repiped, the tax rises yearly. Unlike most plumbing failures, this one is perfectly forecastable: the tap has been reporting it, patiently, for years.
The geography of galvanized failure inside one house is uneven, and the unevenness misleads people. The runs nearest the water heater corrode fastest, worked by heat; long horizontal runs narrow differently from vertical risers; the line to a little-used guest bathroom may be nearly closed while the kitchen still flows. This is why a Fort Wayne home can seem fine at most taps while one shower has given up entirely. Repiping answers the whole geography at once, which is its real argument: not that any single run has failed, but that the system's remaining life is scattered unevenly through every wall, and spot repairs keep buying the shortest-lived section.
In raw numbers, Fort Wayne's exposure is 107,566 homes built before 1980 — the galvanized decades. Behind every one of those front doors is the same material on the same clock, which is why pressure complaints and pinhole leaks cluster by neighbourhood here rather than scattering evenly across the metro.
Water expands as it freezes, and a pipe gives it nowhere to go. The split rarely announces itself in the cold — it waits for the thaw, when pressure returns and the crack opens into a spray inside a wall, a ceiling or a crawl space. The lines that go are predictable: runs through exterior walls, garages, crawl spaces and any stretch the heating never reaches, in homes plumbed before routing pipes through conditioned space became the habit. One hard night is enough; the damage is done by the thaw, and it is usually discovered by the sound of running water in a quiet house or a stain spreading across a ceiling that was dry at breakfast.
A burst pipe is rarely about the coldest night of the year; it is about the one unprotected run of pipe the cold can reach. Water expands as it freezes, and the pressure that splits a line is not the ice itself but the water trapped between the ice blockage and a closed tap. Lines in exterior walls, unheated crawl spaces, garages and hose bibbs are the usual victims — the places where a home's heating never quite arrives. Fort Wayne's older housing carries more of these runs than its newer builds, which route water through conditioned space by design. The thaw is when the damage shows: the split may weep for hours before anyone is home to hear it, which is why the shutoff advice on this page matters more than any repair.
The exposure is written in the climate record: FT WAYNE INTL AP, IN US averages 123.6 nights a year at or below freezing, and it takes only one hard night to split an unprotected line. The housing side of the equation is the metro's older stock — homes from the 1970s and earlier, plumbed before freeze protection was routine, with lines in exterior walls and unheated crawl spaces that modern builds route through conditioned space instead.
One pipe carries everything a house produces, and in the older half of this metro that pipe has been buried since the street was young. Clay sections shift as soil settles; cast iron scales inward; joints open by degrees. The lateral rarely fails all at once — it degrades into symptoms the household learns to live with: the slow drain blamed on the fixture, the gurgle blamed on venting, the cleanings that help for shorter and shorter stretches. Each of those is the lateral reporting its condition. When sewage finally backs up into the ground-floor tub, the line has usually been compromised for a long while, and the question the camera answers is how much of it: a section, or the whole run from house to main.
The lateral is the hardest-working pipe a household owns and the only one nobody ever sees. It carries everything, it was buried once and forgotten, and its condition depends on decisions made the year the house was built: the material chosen, the slope it was laid at, the soil it was bedded in. Ageing laterals fail in characteristic ways — joints offset as soil settles, bellies where the bedding washed or sagged, walls thinned by decades of flow. The house above reports these failures indirectly, through its ground-floor fixtures, which is why a sewer problem so often gets mistaken for a simple clog at first. In Fort Wayne, where whole districts were built in the same few decades, laterals are ageing on a shared timetable — the line under one house is a fair guide to the line under its neighbour's.
The census figures draw the map: 55,889 homes from before 1960 and a median build year of 1976 mean the typical lateral in Fort Wayne has been buried for decades, and the oldest have passed the service life their materials were expected to give. Multiply one buried line by 191,399 housing units and the pattern's rank on this page stops being surprising.
Winter in Fort Wayne is pipe season. With about 123.6 nights a year at or below freezing on the long-term record, the houses that get through winter cleanly are the ones whose exposed lines were dealt with in autumn: insulation on garage and crawl-space runs, hoses off the outside taps so those lines can drain, and a household that knows where its main shutoff is before it needs it. During the hardest cold, a slow drip from the tap furthest from the main and open cabinet doors under sinks on outside walls are simple insurance. If a line does freeze, shut the water off before the thaw does its damage and have the run checked — a pipe that froze once has shown you exactly where it is vulnerable.
Put the season in figures: 123.6 freezing nights a year at FT WAYNE INTL AP, IN US, against a median build year of 1976. Half of Fort Wayne's homes are that old or older, and their exposed lines sit the winter's examination every year — the failures the season produces are simply the papers it fails.
The telltale geography here is generational. Cast iron under a Fort Wayne street means the street predates the metro's plastic era — the blocks around Fort Wayne first, the early suburbs second, almost nothing built after the material left standard practice. A homeowner in those blocks owns a drain in its eighth or ninth decade, and the diagnostic question is never whether the iron has corroded — it has — but how far the corrosion has travelled: a section, a run, or the whole line to the street. Cameras answer it street by street, house by house, and the answers in the oldest blocks rhyme closely enough that experienced local plumbers can often predict the footage before they see it.
Why here and not everywhere: Fort Wayne pairs 107,566 pre-1980 homes with 15.7 days a year at 90 degrees or more and 123.6 nights below freezing. Every metro pairs its housing with its weather somehow; this particular pairing is what puts the pattern where it sits on this page's list, ahead of problems that dominate metros built in other decades, under other skies.
Experienced local practice starts with the simple certainties — the observations that take minutes and decide the most:
 PROBLEM
 SOLUTION
Population 266,235
Population 15,339
Population 10,984
Population 10,539
Population 9,975
Population 3,670
Population 3,342
Population 1,894
Population 1,412
Population 1,333
Population 1,292
Population 1,248
Also in the Fort Wayne metro: Markle (population 1,154), Monroeville (population 1,145).
Beyond Fort Wayne itself, the metro takes in New Haven (15,339 residents), Huntertown (10,984) and the rest of the communities in the grid above — each plumbed in its own building era, which is why two streets in the same metro can need entirely different plumbing conversations. The ZIP list below is the full coverage footprint: if your code is on it, this page was written about your housing stock.
The map continues: Bluffton (10,539), Columbia City (9,975), Leo-Cedarville (3,670), Ossian (3,342), Churubusco (1,894). Different names, different decades — each community in Allen, Wells, Whitley was plumbed in its own growth years, which is why two streets in the same metro can need entirely different plumbing conversations. The ZIP list below is the working definition of coverage; the housing behind each code is the working definition of the job.
The metro's weight is not evenly spread. Fort Wayne holds 266,235 of the 451,440 residents; New Haven and Huntertown add 15,339 and 10,984; and the remainder scatters across the smaller places above, some no bigger than a few thousand people. Plumbing follows the weight — most calls come from where most homes are — but era matters more than size: a small community of 1960s housing generates older-system work than a large new subdivision does.
Draw the metro by its paperwork and it resolves into Allen, Wells, Whitley — 3 jurisdictions sharing one housing stock and one weather system. Allen County holds the historic centre and the densest share of the older homes; the surrounding counties hold the rings of growth around it. Permits and inspections follow those boundaries even though water never does, which is part of why the plumber this page connects you to works these streets specifically.
This page ends at the metro boundary, but the region does not: Elkhart, IN, South Bend, IN and Indianapolis, IN continue the coverage in their own directions, each with a profile built from its own Census and NOAA figures. If your home sits near the line between metros, go by your ZIP code — it places you in the dataset that describes your housing.
Set Fort Wayne among its neighbours and the contrasts sharpen the profile: Elkhart, IN — metro population 208,774, median build year 1977 — sits 53 miles away; South Bend, IN (324,538, median 1969) 71 miles; Indianapolis, IN (2,205,695, median 1982) 94 miles. Three different housing stocks under three nearby skies, which is why each keeps its own page and its own problem ranking rather than borrowing this one.
Ratios tell the metro's story compactly. Renters occupy 29.6% of homes; owners hold the rest. For every home built since 2000 there are 2.8 from before 1980. Spread the stock across the coverage map and each ZIP code carries about 4,785 housing units — the density at which era patterns repeat street after street instead of scattering, and at which a routed round of calls stays inside a few districts.
Fort Wayne by the derived numbers — median home age 50 years · owners in 126,348 homes, renters in 53,124 · each covered ZIP code carrying about 1,397 pre-1960 homes · a heating-to-cooling degree-day ratio of 7.03 · 1,003 mm average annual rainfall.
Before an emergency, read the guide: How to shut off your home's water main
Describe the problem and the call center routes you to an independent local plumber who works in the Fort Wayne metro.
Call center hours: Mon-Fri 7:00 AM-10:00 PM ET | Sat 8:00 AM-10:00 PM ET | Sun 7:00 AM-9:00 PM ET