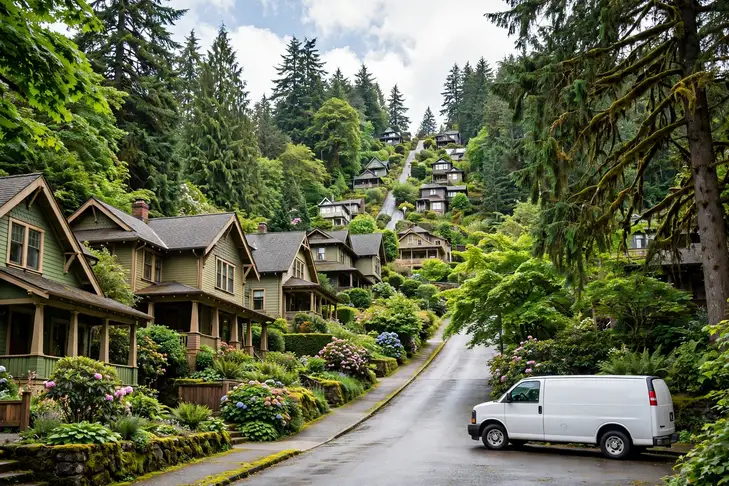


A metro's plumbing is a portrait of its building history under its weather, and Seattle's portrait is painted below from its own records: Census housing figures, NOAA climate normals, the metro's ZIP codes and communities. PlumbReach USA's role is the connection to a local professional; the portrait is here so that connection starts from understanding rather than urgency.
Call center hours: Mon-Fri 7:00 AM-10:00 PM ET | Sat 8:00 AM-10:00 PM ET | Sun 7:00 AM-9:00 PM ET
The median Seattle home was built in 1985; 43.7% of the stock predates 1980, and the pattern this metro's own data ranks first is ageing cast iron sewer lines. PlumbReach USA is a referral service, not a plumbing company: one call connects you with an independent local plumber serving your ZIP code.
Every metro is really several, stacked by decade. Seattle's stack, per the Census, reads: 20.4% of homes from before 1960, a thick middle from the growth decades, and 28.5% from 2000 onward — 1,681,971 housing units in all, wrapped around a median build year of 1985. Plumbing follows the stack faithfully. Each layer went in with its era's materials and workmanship, and each layer is now failing in its era's characteristic order. This page keeps the layering in view throughout, because in a stacked metro the first diagnostic question is never what broke — it is which layer the home belongs to.
There is a materials timeline buried in Seattle's housing figures, and it reads like a plumber's diary. The 343,122 homes from before 1960 were drained in cast iron or clay and supplied, in many cases, in galvanized steel. The 391,899 that followed between 1960 and 1979 mixed those materials with early copper. Then came the 467,588 homes of 1980-1999, plumbed increasingly in copper and early plastics. Each band of that timeline is now a band of characteristic failures, arriving in the order the materials tire — which is why a home's build year, in this metro, is the single most predictive fact about its plumbing.
The growth side of the metro tells the opposite story in the same language. Tacoma, Bellevue and the subdivisions still filling in account for much of the 479,362 homes built since 2000 — plastic supply lines, plastic drains, cartridge fixtures, slab foundations. Their plumbing is not old; it is uniform, which creates its own calendar: everything installed in the same boom reaches each wear point in the same years, from the first water-heater replacements to the first slab-leak scares, while 258 cooling degree days of annual heat keep demand on the system high.
The weather's part in this is written at RENTON MUNI AP, WA US, where an average year carries 34.69 inches of precipitation, 3.9 days at ninety degrees or more and 30.4 nights at freezing or below. Pipes experience that year as workload and as hazard in roughly equal measure — the workload in the heater's cycle count and the drains' burden, the hazard in the exposed runs and the swelling soil. The problem ranking further down is simply the housing profile above, read under this sky.
Two public records, one metro: what was built here, and what the sky does to it.
Lay the eras side by side instead: 20.4% pre-1960 (343,122 homes), 23.3% from 1960-1979 (391,899), 27.8% from 1980-1999 (467,588), and 28.5% since 2000 (479,362). No single era tells the story — the proportions among them do, and those proportions are different in every metro this site covers.
A metro that mostly built itself after 2000 has plumbing with a distinctive trait: uniformity. The same subdivisions, the same materials, the same installation years — and therefore the same maintenance waves, arriving at the same streets in the same seasons. Seattle's older pockets still produce the deepest individual jobs, but the volume lives in the new stock: heater fleets cycling together, cartridges wearing together, slab questions surfacing together. Reading those waves early is most of what local knowledge means here.
The runner-up era is 1980-1999, with 27.8% of homes. That stock has left its carefree decades and entered its maintenance decades, and it shows in the call pattern around Tacoma and the other districts of those years: heaters on their second or third cycle, fixtures reaching their wear points together, drains still young enough to reward attention over replacement.
Seattle's weather, reduced to what a pipe experiences: 3.9 hot days a year loading the drains and heaters, 30.4 freezing nights testing every exposed run, and 34.69 inches of rain moving through the soil that holds the laterals. NOAA's normals at RENTON MUNI AP, WA US — 4,390 heating degree days, 258 cooling degree days — are the long average of that experience, and they are why this metro's problem list is not interchangeable with a milder or harsher metro's.
That is the whole method of this page in one section: era shares from the Census, loads from NOAA, and a problem list that is simply where the two overlap most in Seattle. The services and guidance that follow are ordered by the same profile — local first, generic last.
Chosen by this metro's own housing and weather data — the same two records this whole page is built from.
Cast iron was the standard sewer material for homes built through the middle of the last century, and Seattle still has a great deal of it underground: 20.4% of homes here were built before 1960 and 43.7% before 1980. Cast iron does not fail all at once. It corrodes from the inside out, the bottom of the pipe thinning and scaling until waste catches on the rough surface, and a line that drained freely for decades starts slowing, then backing up. By the time roots find the joints of an old cast iron line, the pipe wall around them is often too thin for cleaning alone to be the whole answer. A camera inspection shows exactly how much good pipe is left: scaling near the top of the line may clean up well, while a channel rotted along the bottom means that section is living on borrowed time. Homeowners in Seattle with a pre-1960 house and drains that misbehave through the whole home — not just one fixture — are usually looking at this story, and the sensible first step is a camera look before another cleaning is booked.
There is a temptation to judge an old drain by its kindest day. On its kindest day it still clears, still serves, still seems to argue for another year. Judge it instead by its trend: clearings that come closer together, a tub that drains slower each season, a smell that returns after rain. In the 343,122 pre-1960 homes across this metro, that trend is the pipe's biography being read aloud — corrosion does not pause between visits, and the homes that fare well are the ones whose owners believed the early chapters.
Put a number on it locally: roughly 343,122 homes in the Seattle metro were built before 1960, when cast iron was the default drain material — and cast iron installed then has now been underground for six decades or more. Not every one of those lines has failed, and plenty test sound on a camera, but the population of pipes at risk here is counted in the tens of thousands of homes, which is why this pattern sits where it does on this page.
A lateral ages in the dark, and its ageing has a geography. The run beneath the house is sheltered; the run beneath the yard takes the soil's full behaviour — swelling after Seattle's 34.69 inches of yearly rain, shrinking in the dry months, shifting at every joint. Add the trees, whose roots read those joints as invitations, and the lateral's condition at any address is a sum of its material, its soil and its canopy. The camera reads the sum directly, which is why sewer advice here starts with footage: the remedy for a rooted joint and the remedy for a settled belly share no resemblance.
A lateral gives decades of silence and then a short conversation. The conversation usually starts with the ground-floor drain in the house and escalates through the cleanout to the camera — and the camera's footage settles every argument about whether the line is blocked or broken. Across Seattle, the laterals entering that conversation now are the ones buried when the metro's median home went up, in 1985. They were built to outlast their mortgages, and they have; the question the footage answers is how much further the same pipe can honestly be asked to go.
The census figures draw the map: 343,122 homes from before 1960 and a median build year of 1985 mean the typical lateral in Seattle has been buried for decades, and the oldest have passed the service life their materials were expected to give. Multiply one buried line by 1,681,971 housing units and the pattern's rank on this page stops being surprising.
The galvanized story can be told at a single tap. Open the fixture farthest from the meter in a Seattle home still on its original steel and watch the stream: respectable for a moment, then thinning as the narrowed runs upstream ration the flow. That rationing is the material's old age made visible — decades of internal rust taxing every gallon. The metro holds 735,021 pre-1980 homes, and in the ones never repiped, the tax rises yearly. Unlike most plumbing failures, this one is perfectly forecastable: the tap has been reporting it, patiently, for years.
Galvanized pipe fails politely, which is exactly the problem — it gives a household years of small warnings that are easy to live with. The zinc coating that once protected the steel wears through, rust takes its place, and the rust grows inward like a narrowing artery. Flow to the farthest fixtures drops first. A shower that shares a line with a running tap loses its pressure. By the time the water itself runs discoloured after the house has sat quiet overnight, the narrowing is well advanced. None of this is a single emergency; it is a system reaching the end of its design life on schedule, and in Seattle's pre-1980 neighbourhoods that schedule is arriving for whole streets at once, because the pipes went in together.
In raw numbers, Seattle's exposure is 735,021 homes built before 1980 — the galvanized decades. Behind every one of those front doors is the same material on the same clock, which is why pressure complaints and pinhole leaks cluster by neighbourhood here rather than scattering evenly across the metro.
Roots do not break into sewer lines; they are invited. A joint that seeps a thread of moisture into the surrounding soil advertises itself to every root tip in reach, and the tip that finds it thickens season by season inside the pipe, weaving a net that catches the household's solids. In Seattle the invitation list is written by its canopy: the established streets where trees and laterals have shared the same ground for half a century. Cutting the roots restores the line for a while; the lasting question the camera answers is what the joint that invited them looks like now.
Not every tree is an equal suspect. Fast-growing species with wide, water-hungry root systems explore the most ground, and a tree planted decades ago over a jointed line has been prospecting along it ever since — root tips follow moisture gradients measured in fractions, straight to the joint that breathes vapour. The mass a camera finds is therefore usually at a joint directly in a root run's path, which is why clearing the roots without addressing the joint is a postponement: the path stays open, the roots regrow along it, and the cycle shortens each time. Sealing or replacing the jointed section is what breaks the rhythm for good.
The preconditions, counted locally: thousands of jointed laterals in the older districts, under street trees given the same decades to mature. Root intrusion is the one pattern on this page that grows more likely with every year a line survives — survival itself is the exposure, and Seattle's oldest lines have survived the longest.
A water heater keeps its accounts in two currencies: temperature and time. Every shower is a withdrawal; every degree the incoming water must be raised is a tax on the recovery. Seattle taxes its tanks from both ends — summer demand volume against winter inlet cold — and the fleet pays out accordingly, the oldest units in the oldest homes first. The strain is rarely visible from outside the closet: it is a shower ending cooler than it began, a tank that fires at hours when nobody has drawn water, a household quietly reorganising its mornings around an appliance's fatigue. Those are the entries in the ledger that precede the failure itself.
Recovery time is the number that runs a household's mornings, and it is the first thing sediment steals. A tank rated to serve a family when new delivers less hot water per heating cycle every year as the sediment layer thickens and the burner's work goes into heating rock instead of water. In Seattle, where summer demand piles showers, laundry and dishwashing into the same hours, that slow decline shows up as a household quietly rationing hot water without ever deciding to. Flushing the tank returns some of it; a spent anode and a rumbling, scaled tank are the signs the decline has become structural, and the conversation turns to replacement.
Do the local sums: 1,586,350 households heating water through 258 cooling degree days and 4,390 heating degree days a year means the metro's heater fleet cycles relentlessly, and sediment settles further with every cycle. Heaters in Seattle rarely die young — they die on schedule, and the schedule is written by how hard the climate makes them work and whether anyone ever drained the sediment out of the tank.
This is the season the metro's housing stock is examined by the weather, and the examination is practical: every exposed run, every unheated void, every shutoff nobody has tested. The failures arrive in batches behind the hardest nights and announce themselves at the thaw. The rest of the season grades the slower systems too — heaters working against the coldest incoming water of the year, laterals under frozen ground — but the headline the season writes, year after year, is the sound of water in a wall that should be dry.
Winter's load on this metro can be counted two ways: in the 30.4 freezing nights RENTON MUNI AP, WA US records, and in the age of the housing that must withstand them — half of it built by 1985 or earlier. Neither number alone predicts a burst; multiplied together, they predict a season. Local plumbers plan their winter around that product, and households in the older districts do well to plan their autumn the same way.
In Seattle the pattern has an address pattern. The cast iron went under the homes built before 1960 — the streets of the old core and the first suburbs around Seattle — and it is failing in the order those streets were built. A camera call in the historic districts is a different appointment from one in Tacoma or the newer subdivisions: there, the same symptoms usually trace to something younger and simpler. Knowing which side of that line a home sits on is most of the diagnosis before the camera ever leaves the van, and it is why this page ranks the problem by the metro's pre-1960 count rather than by anecdote.
Read the ranking backwards and it reads as a data summary: 4,021,467 residents in 1,681,971 housing units, 20.4% of the housing from before 1960, 34.69 inches of rain in an average year. The pattern leads because the exposure is broad — counted not in individual unlucky houses but in whole eras of the metro's building, stacked one on another.
On a first visit for this pattern, a local plumber's checks run in a practised order:
Sequenced by this metro's own problem ranking, not by a national catalogue order.
Between the house and the street lies the lateral — privately owned, commonly forgotten, and the source of the worst backups a home can have. Sewer work begins with a camera survey of that run: its material, its fall, its invaders. Spot repairs suit local damage; a line failing along its length gets replaced, not patched into a subscription.
A lateral's enemies in Seattle are patient and they are local: roots working the joints under the canopy streets of King County, soil that swells with 34.69 inches of yearly rain and shrinks back in the dry stretches, and plain elapsed time in the districts where the pipe predates the pavement above it. Against enemies that slow, the camera is less a diagnostic luxury than the only honest calendar the line will ever get — footage that says whether the pipe has years left, or has been spending them. The remedy scales to that verdict and to no other. In Seattle that holds across 170 ZIP codes, from Seattle out to Bellevue.
Under Seattle lie 1,681,971 laterals, one per housing unit, and the oldest of them — beneath the 343,122 pre-1960 homes — have been underground since the metro was a fraction of its present size. The camera diary in Tacoma and the old core is written by that buried generation.
Where this service gets booked in Seattle follows the map on this page: the older districts generate the deep-end work, the post-2000 subdivisions the wear-and-tear work, and the 467,588 homes in between split the difference. Telling the call center your home's build decade — most Seattle owners know it within a few years — puts the right kit on the van the first time.
Every pipe material carries a lifespan, and pipe services are how a house changes generations. Sectional repair buys time on a sound system; full repiping retires a tired one, replacing choked or pitting lines wall by wall and leaving the household with pressure and water quality it may not have had in years.
Stand in a Seattle street built in the metro's big decades and you are standing over a synchronised experiment: hundreds of homes plumbed in the same material, by the same crews, in the same years, now ageing in unison. Pipe work here is consequently part diagnosis, part census — the plumber reads one home's failure against the street's pattern and can often say what the neighbouring houses will need next. Sectional repair serves the home whose system is sound elsewhere; repiping serves the street-timer home, where the failures have begun arriving in rhythm and the rhythm itself is the diagnosis. Locally the workload concentrates where the stock is oldest — the districts built around the 1980s first.
Pipe work divides by era in this metro with unusual neatness: renewal conversations in the 735,021 pre-1980 homes, sectional repairs in the middle ring, and near-silence from the 479,362 post-2000 homes whose lines are still young. A call from Kent can sit in any of the three bands; the home's build year says which before the door opens.
One local habit worth copying: Seattle homeowners who mention their street's building era when they book get a better-matched visit, because a plumber heading to a the 1980s home in King County loads different parts than one heading to a slab-built subdivision in Tacoma. The service is the same; the preparation is local.
A heater rarely dies all at once; it dims. Recovery slows, temperatures wander, the tank starts talking. Repair makes sense while the vessel is sound; once the steel itself is going, replacement is the honest answer, matched in capacity and fuel to how the household actually uses hot water.
Stand in a Seattle street and count rooflines and you are also, roughly, counting water heaters by age. The subdivisions went up in waves and their tanks were fitted in the same weeks, so the metro's heater fleet ages in convoys — quiet for years, then a whole street replacing within a few seasons. The pre-1980 districts run a different rhythm, individual tanks on individual schedules inside older plumbing. Both rhythms end at the same judgement, made on evidence rather than birthdays: the tank's condition, its repair history, and the household's patience for cold showers while the argument settles. From Tacoma to Bellevue, the pattern repeats wherever the housing era matches.
Heater work in this metro is a fleet problem: the tanks were installed in waves with the subdivisions, and they reach their verdicts in waves too. Renton (105,279 residents) sits inside one of those waves; the older districts run their own, one tank at a time, inside plumbing a generation older.
In Seattle this service is booked most often through the problem patterns at the top of this page — the metro's housing data, not habit, sets the order. If your home is in the 43.7% built before 1980, mention its age on the call: it changes the parts the plumber loads before heading to Seattle and the rest of the metro.
In Seattle the emergency call is routed, not queued: one number reaches the independent local plumber covering King, Pierce, Snohomish at that hour, and the housing record on this page — median build year 1985 — is the homework they arrive already knowing.
Drain work in Seattle splits by era: the 735,021 pre-1980 homes drain through older materials, the post-2000 subdivisions through plastic — and the local plumber reads the cable's return to tell which world your street drains through.
A creeping meter in a Seattle home is located, not guessed at: the professionals routed here trace the line with instruments and confirm the spot before any floor or wall is opened.
Running, rocking or refusing — in Seattle the diagnosis is the same short sequence: fill valve, flapper, supply line, flange. The plumbers routed here carry the internals for the fixtures this metro's eras installed.
Fixture work in Seattle divides by era like everything else on this page: washer-era taps in the older districts, cartridge internals in the post-2000 subdivisions — the local plumber stocks for both.
If this page's services were ranked by Seattle's call patterns rather than listed in catalogue order, they would come out much as they do here — because the ranking behind them is data, not habit. Ageing cast iron sewer lines leads the metro's problem table and ageing sewer laterals follows, so the services answering them lead the list. The long tail of a metro's plumbing life — fixture failures, toilet calls, the single unexplained leak — fills in the diary around them, here as everywhere.
 PROBLEM
 SOLUTION
Population 741,440
Population 220,482
Population 151,199
Population 135,015
Population 111,083
Population 105,279
Population 99,232
Population 91,614
Population 85,455
Population 75,721
Population 71,570
Population 68,161
Also in the Seattle metro: Sammamish (population 66,375), Lakewood (population 63,034).
A metro is a federation of building decades wearing one name, and the grid above is Seattle's federation: Seattle at the centre, Tacoma (220,482 residents) and Bellevue (151,199) in the next ring, and the smaller communities beyond, down to places a few thousand households deep. What unites them is one climate record and one routing; what divides them is the year their streets were plumbed. The ZIP list that follows is the practical definition of that federation — if your code is on it, your home's era is part of the data this page was built from.
Also on the Seattle map: Kent (135,015), Everett (111,083), Renton (105,279), Federal Way (99,232), Kirkland (91,614) — communities spread across King, Pierce, Snohomish, each with housing from its own growth years. A plumber routed through PlumbReach USA to any of them is working from this same page: the metro data does not change at the city limit, but the housing on your street — its age, its materials, its soil — is what the visit is really about.
The metro's weight is not evenly spread. Seattle holds 741,440 of the 4,021,467 residents; Tacoma and Bellevue add 220,482 and 151,199; and the remainder scatters across the smaller places above, some no bigger than a few thousand people. Plumbing follows the weight — most calls come from where most homes are — but era matters more than size: a small community of 1960s housing generates older-system work than a large new subdivision does.
The metro answers to 3 county governments (King, Pierce, Snohomish), a patchwork that matters at permit time rather than at the pipe. King County carries the centre; the others carry the growth rings and the older outlying towns. A plumber routed through this page works inside that patchwork daily — the water does not care about the boundaries, but the job's paperwork does.
Three neighbouring coverage areas begin where this one ends: Bremerton, WA, some 35 miles off; Olympia, WA, 59 miles; and Bellingham, WA, 91 miles. Each keeps its own page because each keeps its own numbers — a different median build year, a different climate station, a different problem ranking. Boundary households should trust the ZIP list over the map: the code, not the compass, assigns the dataset.
Set Seattle among its neighbours and the contrasts sharpen the profile: Bremerton, WA — metro population 283,374, median build year 1986 — sits 35 miles away; Olympia, WA (304,261, median 1991) 59 miles; Bellingham, WA (236,392, median 1988) 91 miles. Three different housing stocks under three nearby skies, which is why each keeps its own page and its own problem ranking rather than borrowing this one.
Divide the stock by the map and the densities appear: roughly 9,894 housing units for every covered ZIP code, 528,783 households to a county, 14 named communities in the grid. The balance between the generations reads 1.5 pre-1980 homes for every home built since 2000 — a single ratio that quietly predicts whether a metro's plumbing week leans toward renewal work in the old districts or first-generation upkeep in the new ones.
The Seattle record in one line — median home age: 41 years · owner-occupied homes: 958,155 · renter-occupied homes: 628,195 · pre-1960 homes per covered ZIP code: 2,018 · heating-to-cooling degree-day ratio: 16.99 · average rainfall: 881 mm a year.
Before an emergency, read the guide: How to shut off your home's water main
Describe the problem and the call center routes you to an independent local plumber who works in the Seattle metro.
Call center hours: Mon-Fri 7:00 AM-10:00 PM ET | Sat 8:00 AM-10:00 PM ET | Sun 7:00 AM-9:00 PM ET