

Everything on this page was computed for Richmond and nowhere else: the problem ranking from its Census housing profile, the seasonal risks from its NOAA station record, the coverage from its own ZIP codes. PlumbReach USA connects you to an independent local plumber; the page itself is the homework, done in public, so the call you make is an informed one.
Call center hours: Mon-Fri 7:00 AM-10:00 PM ET | Sat 8:00 AM-10:00 PM ET | Sun 7:00 AM-9:00 PM ET
The median Richmond home was built in 1984; 44.6% of the stock predates 1980, and the pattern this metro's own data ranks first is freeze-burst pipes in cold snaps. PlumbReach USA is a referral service, not a plumbing company: one call connects you with an independent local plumber serving your ZIP code.
Two numbers frame everything that follows: 67.1% of Richmond homes are owner-occupied, and the median one was built in 1984. Ownership matters to plumbing because owners inherit their systems whole — every material decision a builder made in the 1980s or earlier is still in the walls, ageing on its original schedule. With 44.6% of homes predating 1980 and 25.8% arriving since 2000, the metro is really two housing stocks sharing one map, and they are taken separately below before the problems are ranked.
By now, most of Richmond's pre-1980 homes are on their second plumbing lives in part: a heater replaced, a bathroom renewed, a section of drain renewed after a failure — while the remainder of the original system carries on into its sixth and seventh decades. The 250,359 homes in that stock are therefore not uniformly old; they are individually old, each with its own archaeology of repairs. That is why the pre-1980 districts reward inspection over inference: the street's average says little about the house in front of you, whose real history is written under its floors.
There is a second way to read the growth figures: as a maintenance wave still approaching. The 144,826 homes built since 2000 were handed over with everything new at once — heaters, cartridges, supply lines, seals — and new things age in convoy. The first replacements in those subdivisions have begun; the wave behind them is arithmetic. Households in Tuckahoe and the other growth districts who learn their systems now, while the systems are still young, are the ones who will meet that wave as a schedule rather than a surprise.
Over everything sits the weather, and here it is measured rather than described: NOAA's station at RICHMOND INTL AP, VA US averages 59.0 degrees across the year, with 44.9 days reaching 90 or more and 73.5 nights at freezing or below. A buried lateral feels that record as soil that swells and pulls away; a water heater feels it as an unbroken cycle count; an exposed line feels it on the single coldest night. The problem ranking below is what those numbers, crossed with the housing profile, produce for Richmond specifically.
Two public records, one metro: what was built here, and what the sky does to it.
Break the stock down by building era and the profile sharpens. Before 1960: 21.5% of homes, roughly 120,689 of them. From 1960 to 1979: 23.1%, about 129,670. From 1980 to 1999: 29.6%, about 166,158. Since 2000: 25.8%, about 144,826. Four eras, four material palettes — and the balance among them is this metro's plumbing character in a single paragraph.
The metro's plumbing present was installed between 1980 and 1999, and it is ageing as a cohort. That cohort's traits are consistent: sound bones, wearing surfaces. The systems beneath these homes are not failing from corrosion sagas but from the accumulated cycles of two to four decades — and the work they generate is the steady, schedulable kind, provided it is scheduled. Left alone, cohort ageing has a way of arriving all at once; attended to, it is the most manageable profile a metro can have.
Behind the leading era, the growth band: 25.8% of homes arrived since 2000. Their plumbing is uniform by construction — one generation of fixtures, one approach to lines under slabs — which writes a shared calendar the whole street keeps. Reading that calendar early is most of what separates a planned replacement from a weekend emergency in Richmond's newest districts.
Richmond's weather, reduced to what a pipe experiences: 44.9 hot days a year loading the drains and heaters, 73.5 freezing nights testing every exposed run, and 45.5 inches of rain moving through the soil that holds the laterals. NOAA's normals at RICHMOND INTL AP, VA US — 3,736 heating degree days, 1,560 cooling degree days — are the long average of that experience, and they are why this metro's problem list is not interchangeable with a milder or harsher metro's.
A profile is only useful if it predicts something, and this one predicts the shape of a plumbing diary in Richmond: which streets will call about drains, which about pressure, which about heaters, and in which months. Everything after this section is that prediction written out as services, problems and answers — the numbers first, the narrative second, the way the evidence actually runs.
Chosen by this metro's own housing and weather data — the same two records this whole page is built from.
Water expands as it freezes, and a pipe gives it nowhere to go. The split rarely announces itself in the cold — it waits for the thaw, when pressure returns and the crack opens into a spray inside a wall, a ceiling or a crawl space. The lines that go are predictable: runs through exterior walls, garages, crawl spaces and any stretch the heating never reaches, in homes plumbed before routing pipes through conditioned space became the habit. One hard night is enough; the damage is done by the thaw, and it is usually discovered by the sound of running water in a quiet house or a stain spreading across a ceiling that was dry at breakfast.
The burst itself usually happens quietly, inside a wall or under a floor, during the coldest hours — but the flood waits for the thaw. Ice seals the split it made, and only when temperatures rise and the ice lets go does the water start moving into the house. That delay is why freeze damage so often greets a Richmond household in the morning or on return from a trip away. It is also why the checks after a hard freeze matter: pressure oddly low, a meter turning with nothing running, a damp patch at a wall base. Catch the split at the weep stage and the repair is a pipe; catch it after the thaw and it is a room.
Local exposure, stated plainly: a large stock of homes plumbed before freeze protection was designed-in, standing in a climate that freezes on 73.5 nights a year. Either figure alone is unremarkable; together they describe a metro where burst lines are a seasonal category of call, not an anomaly.
Iron drains do not fail the way modern pipes fail. Plastic cracks; iron thins, roughens and narrows from within, wall by wall, until the smooth bore the installer left is a reef of corrosion products that catches everything the household sends down. In Richmond, that reef is growing under the oldest streets in the metro — the homes around Richmond plumbed when iron was the only serious choice. A line in this condition can serve for years in a diminished way, draining slowly, complaining occasionally, which is exactly how it escapes attention until the day it stops entirely.
The pipe itself explains the timeline. Cast iron drains by gravity, slowly, and everything a household sends down it — grease films, mineral-heavy water, the occasional corrosive cleaner — works on the iron for decades. The metal does not fail evenly: it thins first at the bottom of horizontal runs, where water and grit sit longest, and at the joints where sections meet. That is why two Richmond homes of the same age can be in different places with the same pipe: usage, water chemistry and soil conditions around the line all vote on how fast it goes. What a camera inspection adds is certainty — the difference between a line that needs cleaning, a line that needs a section replaced, and a line living on borrowed time.
The historical record is the evidence: iron was the default drain material for the whole era that built this metro's core, and the Census counts that era's survivors home by home — 120,689 of them. Camera surveys in those districts confirm the arithmetic often enough that the pattern's ranking here is the least speculative thing on this page.
Between the house and the street connection sits the lateral — the home's own stretch of sewer line — and it is the homeowner's responsibility, which surprises many people the first time it fails. In Richmond, where 21.5% of homes were built before 1960 and the median home dates to 1984, laterals have been in the ground through decades of soil movement, root growth and material ageing. Clay joints shift and open, older pipe bellies where bedding has washed out, and a line can lose its clean fall to the street, so waste slows, settles and eventually blocks. The signs are house-wide rather than fixture-specific: several drains slow together, the ground-floor fixtures act up first, and cleanings help for shorter and shorter stretches. A camera run down the lateral settles the argument about what is happening — it measures the damage by distance, shows whether it is one bad joint or the whole story of the line, and lets the repair be sized to the actual problem instead of the whole run by default.
Slope is the lateral's invisible specification. A sewer line does not need much fall — a quarter inch per foot is the classic figure — but it needs it consistently, and ageing takes consistency away: a section settles, a joint steps down, and the line develops a reach where flow slows and solids settle out. That belly then collects a little more each week, narrowing the line from the bottom up. Many a Richmond lateral diagnosed as 'blocked' is really 'bellyed' — clearable today, certain to collect again. The camera distinguishes the two, and the distinction decides whether the household is booking a cleaning or planning a repair.
Think of the laterals as a hidden census: 561,343 lines, one per home, the oldest of them — serving the 120,689 pre-1960 homes — now in their seventh decade underground. They age in soil that moves with Richmond's seasons, and their condition surfaces only as symptoms inside the house, which is why so many are discovered late.
Galvanized steel announces its age through the water itself. The zinc coating that once protected the pipe is long spent; the steel beneath rusts inward, and the bore narrows to a passage that delivers less water every year. Households adapt without noticing — the shower accepted as weak, the washing machine's fill taken as slow — until a fixture upgrade or a guest's comparison names the decline. In Richmond's pre-1980 districts that decline is the stock's shared condition, written into 250,359 homes, and the repipe conversation begins when the household stops adapting and starts measuring.
Galvanized pipe fails politely, which is precisely the problem. No flood, no drama — just a shower that weakens across years, a washing machine that fills slowly, water that blushes rust after holidays. Households adapt without noticing, the way you adapt to a dimming bulb. The 129,670 homes built in this metro between 1960 and 1979 stand in the front of that queue now, their original steel bores narrowed to drinking-straw width in the worst runs. The fix, when it comes, tends to astonish people — not with its scale, but with the pressure they had forgotten they were owed.
Count it by era rather than by street: the metro's homes built between the war years and 1980 — the heart of the galvanized period — number in the tens of thousands here, and the 250,359 pre-1980 homes overall are the pool this problem draws from. Plumbers working Richmond and the older districts can often date a home's pipework from the kerb, because the building booms that raised those neighbourhoods plumbed them all the same way.
A tank heater is a vessel that cooks its own lining. Every heating cycle precipitates minerals out of the water, and they settle on the tank floor as sediment — an insulating blanket that makes the burner or element work longer, rumbling as steam pockets form and collapse beneath it. Meanwhile the anode rod, installed to be corroded in the steel's place, quietly spends itself. When it is gone, the tank itself is next. The pattern is universal, but the pace belongs to the local water and the local climate: the harder a metro heats and the more hot water its households draw, the sooner the rumble, the rust-tinged water and the puddle at the base arrive to announce the end of a heater's service.
Recovery time is the number that runs a household's mornings, and it is the first thing sediment steals. A tank rated to serve a family when new delivers less hot water per heating cycle every year as the sediment layer thickens and the burner's work goes into heating rock instead of water. In Richmond, where summer demand piles showers, laundry and dishwashing into the same hours, that slow decline shows up as a household quietly rationing hot water without ever deciding to. Flushing the tank returns some of it; a spent anode and a rumbling, scaled tank are the signs the decline has become structural, and the conversation turns to replacement.
Do the local sums: 523,778 households heating water through 1,560 cooling degree days and 3,736 heating degree days a year means the metro's heater fleet cycles relentlessly, and sediment settles further with every cycle. Heaters in Richmond rarely die young — they die on schedule, and the schedule is written by how hard the climate makes them work and whether anyone ever drained the sediment out of the tank.
Winter in Richmond is pipe season. With about 73.5 nights a year at or below freezing on the long-term record, the houses that get through winter cleanly are the ones whose exposed lines were dealt with in autumn: insulation on garage and crawl-space runs, hoses off the outside taps so those lines can drain, and a household that knows where its main shutoff is before it needs it. During the hardest cold, a slow drip from the tap furthest from the main and open cabinet doors under sinks on outside walls are simple insurance. If a line does freeze, shut the water off before the thaw does its damage and have the run checked — a pipe that froze once has shown you exactly where it is vulnerable.
Put the season in figures: 73.5 freezing nights a year at RICHMOND INTL AP, VA US, against a median build year of 1984. Half of Richmond's homes are that old or older, and their exposed lines sit the winter's examination every year — the failures the season produces are simply the papers it fails.
Freeze damage in Richmond is not evenly distributed, and the climate record explains the map. The splits happen where cold air and water lines meet: exterior walls, crawl spaces, garages, additions — features of the older housing in the districts around Richmond and the pre-war pockets, plumbed before routing lines through heated space was standard. The record at RICHMOND INTL AP, VA US — 73.5 freezing nights in an average year — says the examination is annual. A home passes it by where its lines run, not by how new they are, which is why a 1950s house with interior lines can outscore a newer build with a garage run.
The numbers underneath it, for Richmond: 561,343 housing units, a median build year of 1984, and a climate record at RICHMOND INTL AP, VA US of 3,736 heating degree days against 1,560 cooling degree days. Cross the housing record with the weather record and this pattern is what falls out at the top — rarely the most dramatic problem in plumbing, but the one this metro's stock and climate manufacture most steadily.
Experienced local practice starts with the simple certainties — the observations that take minutes and decide the most:
Ordered by what this metro's data says its homes need most.
Every pipe material carries a lifespan, and pipe services are how a house changes generations. Sectional repair buys time on a sound system; full repiping retires a tired one, replacing choked or pitting lines wall by wall and leaving the household with pressure and water quality it may not have had in years.
A repipe decision in Richmond is usually made at a kitchen table, from three exhibits: the water's behaviour at the taps, the count of repairs already paid for, and the material visible wherever the system shows itself. Exhibits like those persuade because they are the household's own. The work itself, when it comes, is less disruptive than its reputation — modern lines route through attics, closets and chases, water stays on for most of the project, and the plaster sacrificed is measured in patches, not rooms. What the household buys back is the thing the old material had been taxing away: pressure, clarity, and the right to forget the pipes exist. With a median build year of 1984, most of the metro's 561,343 housing units are working through the same ageing curve.
Pipe work divides by era in this metro with unusual neatness: renewal conversations in the 250,359 pre-1980 homes, sectional repairs in the middle ring, and near-silence from the 144,826 post-2000 homes whose lines are still young. A call from Tuckahoe can sit in any of the three bands; the home's build year says which before the door opens.
Where this service gets booked in Richmond follows the map on this page: the older districts generate the deep-end work, the post-2000 subdivisions the wear-and-tear work, and the 166,158 homes in between split the difference. Telling the call center your home's build decade — most Richmond owners know it within a few years — puts the right kit on the van the first time.
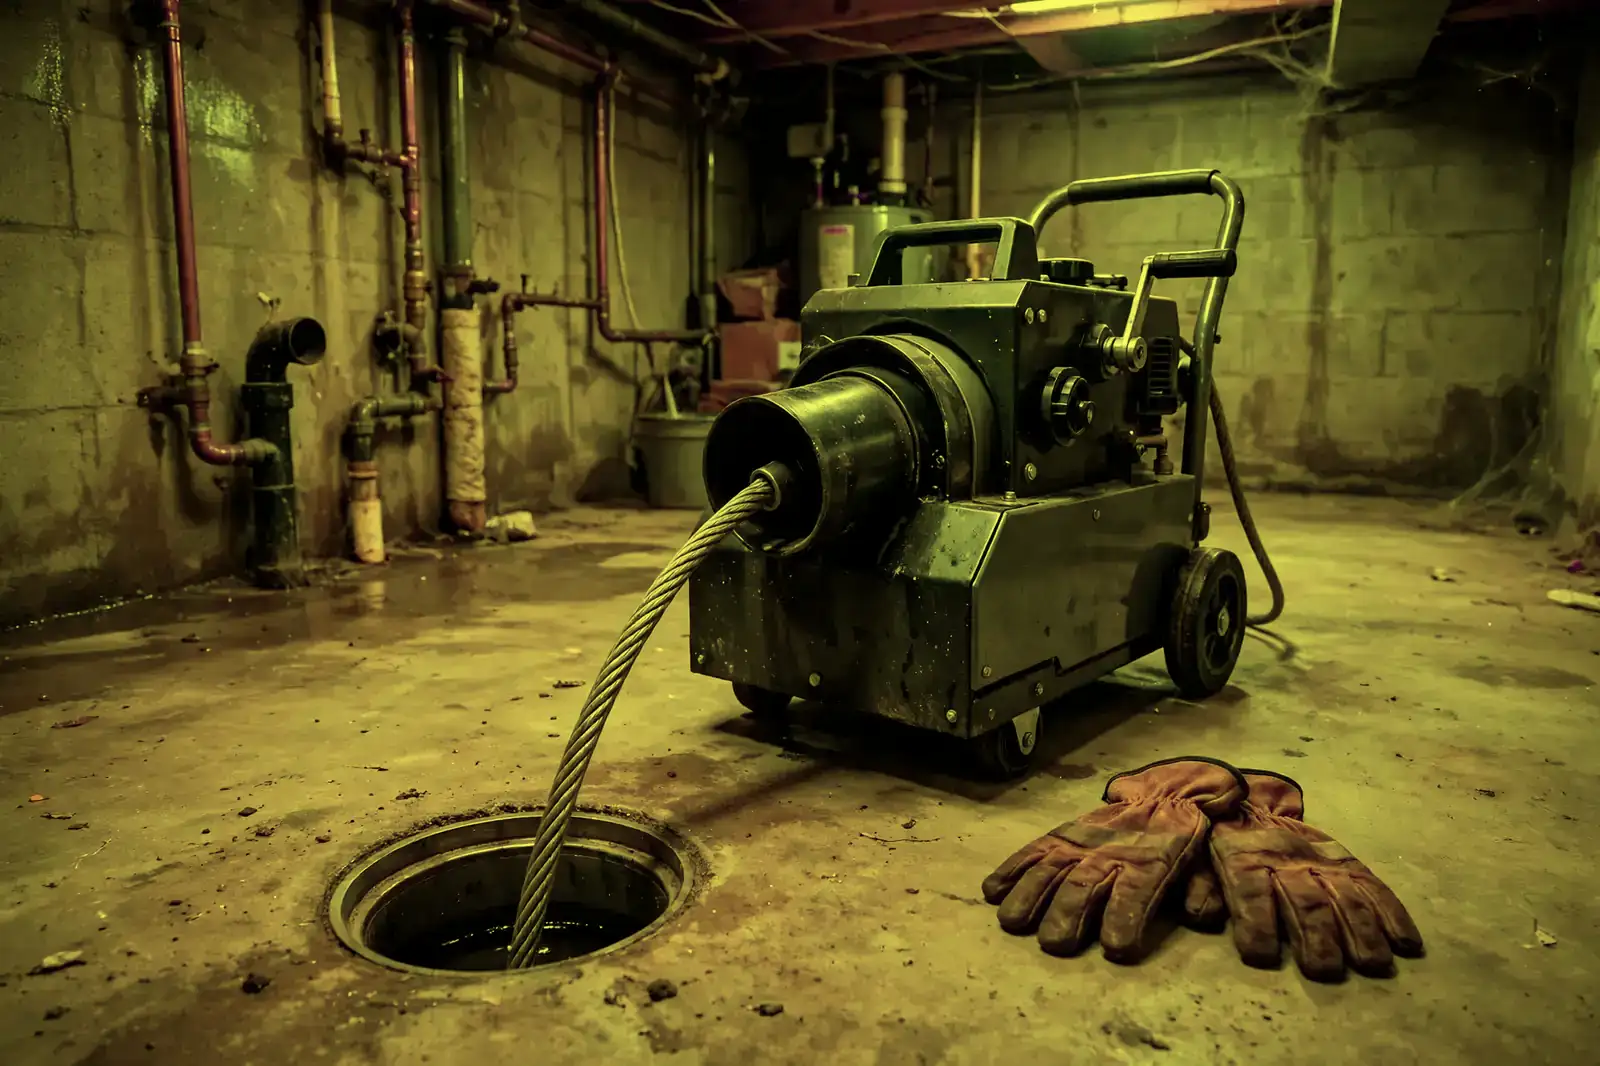
The sewer line is the one pipe every other pipe depends on. When it bellies, cracks or fills with roots, the whole house feels it through its ground-floor fixtures. Repair ranges from sectional fixes through a cleanout to full replacement, chosen from camera footage rather than guesswork.
Consider the lateral as the home's only road out: every drain, every flush, every appliance discharge travels it. In Richmond's older districts that road was built generations ago, in sections, and it has been subsiding, rooting and corroding on its own schedule ever since. The sewer visit surveys the road before recommending anything — its material, its slope, where it is broken versus merely blocked — because the remedies differ by an order of magnitude and the footage, not the symptom, is what separates them. A cleared symptom on a broken road is a postponement, and local plumbers here give their advice accordingly: honestly, from the camera's evidence. Ask in Petersburg and the answer rhymes with Richmond: same eras, same materials, same calendar of failures.
Sewer demand follows the founding map: the districts built first, around the old centre and out through Petersburg, hold the jointed clay and iron; the growth rings hold plastic with decades in hand. 21.5% of the metro's homes stand on the founding side of that line, which is why the footage here so often shows a pipe at the end of its story.
One local habit worth copying: Richmond homeowners who mention their street's building era when they book get a better-matched visit, because a plumber heading to a the 1980s home in Amelia County loads different parts than one heading to a slab-built subdivision in Tuckahoe. The service is the same; the preparation is local.
Everything hot in a house — showers, laundry, dishes — passes through one tank, which is why its failures empty the whole routine at once. Servicing covers the wearing parts and the safety valve; installation work sets its successor up level, vented, drained and strapped, ready for its own decade of mornings.
In Richmond, a water heater's biography is written by two authors: the household and the climate. The household writes the demand — showers, laundry, the dishwasher's nightly run — and the climate edits it, raising inlet temperatures through the 44.9 hot days and dropping them through the cold snaps, so the tank's workload swings with the year. Sediment accumulates through both drafts. Servicing reads the manuscript and corrects what can be corrected; replacement starts a new one, sized for the household's actual chapters rather than the previous tank's guess. From Tuckahoe to Mechanicsville, the pattern repeats wherever the housing era matches.
Heater work in this metro is a fleet problem: the tanks were installed in waves with the subdivisions, and they reach their verdicts in waves too. Chester (23,519 residents) sits inside one of those waves; the older districts run their own, one tank at a time, inside plumbing a generation older.
In Richmond this service is booked most often through the problem patterns at the top of this page — the metro's housing data, not habit, sets the order. If your home is in the 44.6% built before 1980, mention its age on the call: it changes the parts the plumber loads before heading to Richmond and the rest of the metro.
In Richmond the emergency call is routed, not queued: one number reaches the independent local plumber covering Amelia, Charles City, Chesterfield, Dinwiddie, Goochland, Hanover, Henrico, King and Queen, King William, New Kent, Powhatan, Prince George, Sussex, Colonial Heights city, Hopewell city, Petersburg city, Richmond city at that hour, and the housing record on this page — median build year 1984 — is the homework they arrive already knowing.
Across Amelia, Charles City, Chesterfield, Dinwiddie, Goochland, Hanover, Henrico, King and Queen, King William, New Kent, Powhatan, Prince George, Sussex, Colonial Heights city, Hopewell city, Petersburg city, Richmond city, drain calls follow the building map: iron and clay near the old core around Richmond, plastic at the growth edge — one service, two different crafts, both covered by the routing on this page.
A creeping meter in a Richmond home is located, not guessed at: the professionals routed here trace the line with instruments and confirm the spot before any floor or wall is opened.
Running, rocking or refusing — in Richmond the diagnosis is the same short sequence: fill valve, flapper, supply line, flange. The plumbers routed here carry the internals for the fixtures this metro's eras installed.
Fixture work in Richmond divides by era like everything else on this page: washer-era taps in the older districts, cartridge internals in the post-2000 subdivisions — the local plumber stocks for both.
If this page's services were ranked by Richmond's call patterns rather than listed in catalogue order, they would come out much as they do here — because the ranking behind them is data, not habit. Freeze-burst pipes in cold snaps leads the metro's problem table and ageing cast iron sewer lines follows, so the services answering them lead the list. The long tail of a metro's plumbing life — fixture failures, toilet calls, the single unexplained leak — fills in the diary around them, here as everywhere.
 PROBLEM
 SOLUTION
Population 227,595
Population 48,610
Population 38,437
Population 33,365
Population 28,177
Population 23,519
Population 22,944
Population 20,383
Population 18,702
Population 18,210
Population 18,180
Population 17,302
Also in the Richmond metro: Glen Allen (population 16,630), East Highland Park (population 16,071).
Beyond Richmond itself, the metro takes in Tuckahoe (48,610 residents), Mechanicsville (38,437) and the rest of the communities in the grid above — each plumbed in its own building era, which is why two streets in the same metro can need entirely different plumbing conversations. The ZIP list below is the full coverage footprint: if your code is on it, this page was written about your housing stock.
The map continues: Petersburg (33,365), Short Pump (28,177), Chester (23,519), Hopewell (22,944), Meadowbrook (20,383). Different names, different decades — each community in Amelia, Charles City, Chesterfield, Dinwiddie, Goochland, Hanover, Henrico, King and Queen, King William, New Kent, Powhatan, Prince George, Sussex, Colonial Heights city, Hopewell city, Petersburg city, Richmond city was plumbed in its own growth years, which is why two streets in the same metro can need entirely different plumbing conversations. The ZIP list below is the working definition of coverage; the housing behind each code is the working definition of the job.
Richmond (227,595 residents) anchors the metro, and Tuckahoe (48,610) is its second centre of gravity. Between them they hold the bulk of the 523,778 households — and, not coincidentally, the bulk of every housing era this page discusses, from the pre-1960 core to the newest subdivisions. Mechanicsville (38,437) and the communities beyond it repeat the same eras at smaller scale.
Draw the metro by its paperwork and it resolves into Amelia, Charles City, Chesterfield, Dinwiddie, Goochland, Hanover, Henrico, King and Queen, King William, New Kent, Powhatan, Prince George, Sussex, Colonial Heights city, Hopewell city, Petersburg city, Richmond city — 17 jurisdictions sharing one housing stock and one weather system. Amelia County holds the historic centre and the densest share of the older homes; the surrounding counties hold the rings of growth around it. Permits and inspections follow those boundaries even though water never does, which is part of why the plumber this page connects you to works these streets specifically.
This page ends at the metro boundary, but the region does not: Virginia Beach–Norfolk, VA, Charlottesville, VA and Lynchburg, VA continue the coverage in their own directions, each with a profile built from its own Census and NOAA figures. If your home sits near the line between metros, go by your ZIP code — it places you in the dataset that describes your housing.
Set Richmond among its neighbours and the contrasts sharpen the profile: Virginia Beach–Norfolk, VA — metro population 1,797,213, median build year 1983 — sits 63 miles away; Charlottesville, VA (228,597, median 1988) 74 miles; Lynchburg, VA (269,169, median 1980) 96 miles. Three different housing stocks under three nearby skies, which is why each keeps its own page and its own problem ranking rather than borrowing this one.
Divide the stock by the map and the densities appear: roughly 5,613 housing units for every covered ZIP code, 30,810 households to a county, 14 named communities in the grid. The balance between the generations reads 1.7 pre-1980 homes for every home built since 2000 — a single ratio that quietly predicts whether a metro's plumbing week leans toward renewal work in the old districts or first-generation upkeep in the new ones.
The Richmond record in one line — median home age: 42 years · owner-occupied homes: 351,455 · renter-occupied homes: 172,323 · pre-1960 homes per covered ZIP code: 1,207 · heating-to-cooling degree-day ratio: 2.39 · average rainfall: 1,156 mm a year.
Before an emergency, read the guide: How to shut off your home's water main
One call connects you with an independent local plumbing professional serving Richmond and the surrounding metro.
Call center hours: Mon-Fri 7:00 AM-10:00 PM ET | Sat 8:00 AM-10:00 PM ET | Sun 7:00 AM-9:00 PM ET