A metro's plumbing is a portrait of its building history under its weather, and Norwich–New London's portrait is painted below from its own records: Census housing figures, NOAA climate normals, the metro's ZIP codes and communities. PlumbReach USA's role is the connection to a local professional; the portrait is here so that connection starts from understanding rather than urgency.
Call center hours: Mon-Fri 7:00 AM-10:00 PM ET | Sat 8:00 AM-10:00 PM ET | Sun 7:00 AM-9:00 PM ET
62
ZIP codes covered
1
County in the metro
114,577
Households (Census ACS)
1969
Median year home built
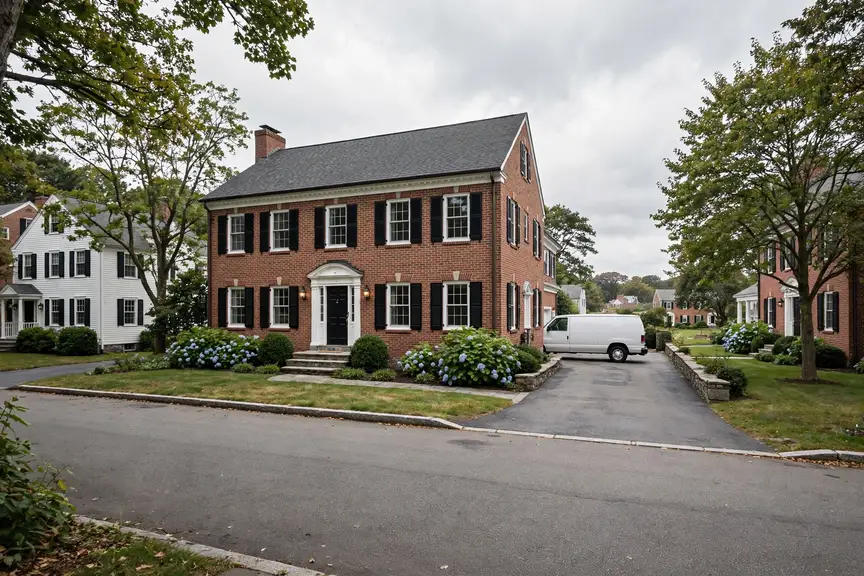
Norwich–New London, CT — plumbing help across the metroLocal plumbers serving Norwich–New London neighbourhoodsReplacing a heater in a Norwich–New London home
Norwich–New London plumbing, in brief
The median Norwich–New London home was built in 1969; 65.3% of the stock predates 1980, and the pattern this metro's own data ranks first is ageing cast iron sewer lines. PlumbReach USA is a referral service, not a plumbing company: one call connects you with an independent local plumber serving your ZIP code.
The Norwich–New London housing stock, and what it means for plumbing
The stock, in one pass: 279,025 residents, 125,728 housing units, 114,577 households — and a build history that splits the metro into plumbers' generations. 38.9% of homes stand from before 1960; 65.3% from before 1980; the rest divide between the late-century suburbs and the 13.6% built since 2000. Every era is a materials decision still in force: the pipes in a Norwich–New London wall are the ones its decade specified, ageing on that decade's schedule, whatever the current owner's plans for them.
By now, most of Norwich–New London's pre-1980 homes are on their second plumbing lives in part: a heater replaced, a bathroom renewed, a section of drain renewed after a failure — while the remainder of the original system carries on into its sixth and seventh decades. The 82,100 homes in that stock are therefore not uniformly old; they are individually old, each with its own archaeology of repairs. That is why the pre-1980 districts reward inspection over inference: the street's average says little about the house in front of you, whose real history is written under its floors.
The post-2000 homes have a plumbing trait the older districts never had: uniformity at scale. A subdivision's lines went in within a few seasons of each other, so its first heater failures, its first cartridge failures and its first slab questions arrive within a few seasons of each other too. With 17,099 such homes in the metro, those arrivals are not anecdotes but waves, and the households who read them early — who learn their system's age and keep its number handy — meet them as maintenance rather than emergency.
The weather's part in this is written at GROTON NEW LONDON AP, CT US, where an average year carries 39.31 inches of precipitation, 1.8 days at ninety degrees or more and 107.2 nights at freezing or below. Pipes experience that year as workload and as hazard in roughly equal measure — the workload in the heater's cycle count and the drains' burden, the hazard in the exposed runs and the swelling soil. The problem ranking further down is simply the housing profile above, read under this sky.
The Norwich–New London plumbing profile in numbers
Two public records, one metro: what was built here, and what the sky does to it.
Break the stock down by building era and the profile sharpens. Before 1960: 38.9% of homes, roughly 48,908 of them. From 1960 to 1979: 26.4%, about 33,192. From 1980 to 1999: 21.1%, about 26,529. Since 2000: 13.6%, about 17,099. Four eras, four material palettes — and the balance among them is this metro's plumbing character in a single paragraph.
Vintage is destiny in this metro. With the pre-1960 band the largest of the four, the centre of gravity of Norwich–New London's plumbing sits in systems that have already outlived their design lives — iron drains gone rough inside, steel supplies thinned by their own rust, clay joints shifted by seven decades of soil. The later bands matter, and the post-2000 subdivisions will write their own chapter in time, but the calls that define plumbing here come disproportionately from the oldest streets, and they will keep coming until that stock is renewed pipe by pipe.
The second band in the table is the 1960-1979 stock: 33,192 homes, 26.4% of the metro. It is the transition generation — copper arriving, galvanized lingering, drains mixed street by street — and it supplies Norwich–New London with its most diagnostic plumbing: two homes of the same year needing opposite answers, decided by what the builder happened to specify.
Start the climate half where the water starts: underground. Norwich–New London's laterals rest in soil that takes 39.31 inches of rain in an average year and dries between deluges, swelling and shrinking against their joints through every season. Above ground the same record reads as workload — 608 cooling degree days of hot-water demand, 5,521 heating degree days of cold incoming water at GROTON NEW LONDON AP, CT US. A plumbing system here is never in neutral; the record keeps it working at one end or the other all year.
Hold the two halves together and the rest of this page explains itself: the problems ranked highest here are the ones where Norwich–New London's dominant housing era and its climate record overlap. Change either dataset and the ranking changes — which is precisely why this profile is rebuilt from the records for every metro instead of carried over from the last one.
Plumbing problems Norwich–New London homes actually get
Chosen by this metro's own housing and weather data — the same two records this whole page is built from.
Ageing cast iron sewer lines
Cast iron's failure is chemical before it is mechanical. Decades of waste water and vent gases work the pipe's crown and bore, converting sound iron to a roughened, thinning shell whose inner surface snags everything the household sends down. In Norwich–New London, where 48,908 homes predate 1960, that chemistry has had sixty years and more to run. The symptoms arrive from the bottom of the system upward — the ground-floor fixtures complain first — and the diagnosis is a camera run that reads the bore the way a doctor reads a scan: where scale can be scoured back, and where the pipe itself has become the obstruction.
Look inside an old cast iron line with a camera and the failure stops being abstract. The inner wall grows rough with tuberculation — rust nodules that narrow the bore and catch everything passing. The bottom of the run, where water and grit travel, thins fastest; the top can look sound while the channel below it is nearly through. Roots enter at joints and add their own blockage. A Norwich–New London line of this vintage is therefore not one problem but a profile of problems along its length, and the repair that makes sense — cleaning, a section, a full replacement — is the one matched to the worst ten feet the camera finds, not the average of the whole run.
Count it from the Census side: 48,908 homes in this metro predate 1960, and the drain lines beneath them were cast in an era that assumed a working life now fully spent. They will not all fail at once — they will fail one street at a time, in the order the corrosion reaches, which is what makes the pattern a ranking on this page rather than a footnote.
Watch for
Whole-house slow drains in a home built before 1960
Backups that return within months of a cleaning
Sewer odour near the yard or a soggy strip of lawn
Run two taps at once in a galvanized house and the second one apologises. That is the material's signature in old age: rust accreting inside the bore until the pipe delivers a fraction of its designed flow, weakest at the far end of the run. Norwich–New London carries 82,100 pre-1980 homes, and the ones still on original galvanized announce themselves the same way — pressure that fades year by year, water that runs tea-coloured after a quiet weekend. Repiping is simply the moment the household stops negotiating with the symptom and replaces the cause.
Galvanized pipe fails politely, which is exactly the problem — it gives a household years of small warnings that are easy to live with. The zinc coating that once protected the steel wears through, rust takes its place, and the rust grows inward like a narrowing artery. Flow to the farthest fixtures drops first. A shower that shares a line with a running tap loses its pressure. By the time the water itself runs discoloured after the house has sat quiet overnight, the narrowing is well advanced. None of this is a single emergency; it is a system reaching the end of its design life on schedule, and in Norwich–New London's pre-1980 neighbourhoods that schedule is arriving for whole streets at once, because the pipes went in together.
Count the exposure from the Census side: the metro's 82,100 pre-1980 homes were plumbed in galvanized's long reign, and the material's failure mode — internal rust, narrowing bore — is a matter of chemistry, not workmanship. The variable is speed; the direction, for every one of those systems still original, is settled.
Watch for
Water running rusty-brown first thing in the morning, then clearing
Pressure noticeably weaker at the far end of the house than near the meter
Neighbours on the same street reporting the same slow decline
Ice does its damage in silence and announces it in flood. The split forms under pressure while the line is frozen, holds while the ice plug seals it, and opens the moment the thaw restores flow — which is why burst pipes are so often discovered by sound: water running somewhere it should not be, in a house that was intact at breakfast. Norwich–New London's exposure sits where its housing does — in the older districts' unprotected runs and every era's additions and garages — and the repair visit's second job, after the pipe itself, is the insulation and routing that keep the same night from repeating.
A burst pipe is rarely about the coldest night of the year; it is about the one unprotected run of pipe the cold can reach. Water expands as it freezes, and the pressure that splits a line is not the ice itself but the water trapped between the ice blockage and a closed tap. Lines in exterior walls, unheated crawl spaces, garages and hose bibbs are the usual victims — the places where a home's heating never quite arrives. Norwich–New London's older housing carries more of these runs than its newer builds, which route water through conditioned space by design. The thaw is when the damage shows: the split may weep for hours before anyone is home to hear it, which is why the shutoff advice on this page matters more than any repair.
The exposure is written in the climate record: GROTON NEW LONDON AP, CT US averages 107.2 nights a year at or below freezing, and it takes only one hard night to split an unprotected line. The housing side of the equation is the metro's older stock — homes from the 1960s and earlier, plumbed before freeze protection was routine, with lines in exterior walls and unheated crawl spaces that modern builds route through conditioned space instead.
Watch for
A pipe that froze during a cold snap, even if it did not burst
Water stains appearing as temperatures rise after a freeze
Exposed lines in garages, crawl spaces or outside walls
This is the season the metro's housing stock is examined by the weather, and the examination is practical: every exposed run, every unheated void, every shutoff nobody has tested. The failures arrive in batches behind the hardest nights and announce themselves at the thaw. The rest of the season grades the slower systems too — heaters working against the coldest incoming water of the year, laterals under frozen ground — but the headline the season writes, year after year, is the sound of water in a wall that should be dry.
The numbers behind the season here: 107.2 nights a year at or below freezing at GROTON NEW LONDON AP, CT US, against a housing stock whose median build year is 1969. Every winter writes the same exam for Norwich–New London's older pipes, and every winter some of them — usually in the the 1960s districts first — fail it.
A closer look: ageing cast iron sewer lines in Norwich–New London
The telltale geography here is generational. Cast iron under a Norwich–New London street means the street predates the metro's plastic era — the blocks around New Haven first, the early suburbs second, almost nothing built after the material left standard practice. A homeowner in those blocks owns a drain in its eighth or ninth decade, and the diagnostic question is never whether the iron has corroded — it has — but how far the corrosion has travelled: a section, a run, or the whole line to the street. Cameras answer it street by street, house by house, and the answers in the oldest blocks rhyme closely enough that experienced local plumbers can often predict the footage before they see it.
Read the ranking backwards and it reads as a data summary: 279,025 residents in 125,728 housing units, 38.9% of the housing from before 1960, 39.31 inches of rain in an average year. The pattern leads because the exposure is broad — counted not in individual unlucky houses but in whole eras of the metro's building, stacked one on another.
The first visit follows a short, diagnostic list — each item ruling a branch of the problem in or out:
The ground-floor fixtures first — a main-line problem reports there before anywhere else
The age and material of the line, from the home's era and any past camera reports
Whether gurgling tracks the washing machine's discharge — a classic main-line signature
The cleanout's cap and condition, and whether it has ever been opened
Plumbing services in Norwich–New London
Listed in the order this metro's housing and climate data supports.
Sewer Line Repair & Replacement in Norwich–New London
The sewer line is the one pipe every other pipe depends on. When it bellies, cracks or fills with roots, the whole house feels it through its ground-floor fixtures. Repair ranges from sectional fixes through a cleanout to full replacement, chosen from camera footage rather than guesswork.
Sewer trouble in Norwich–New London rarely starts with the sewer. It starts with the ground-floor drain in the house misbehaving, and by the time sewage backs into a tub, the line outside has been compromised for a while — roots thickening at a joint, a belly deepening, cast iron scaling shut. The metro's older districts, where the housing predates 1960 by the thousands of homes, produce most of these calls; the established trees over those streets are both the neighbourhood's charm and its sewer lines' oldest enemy. The repair conversation here begins with a camera, not a shovel. Ask in West Hartford and the answer rhymes with New Haven: same eras, same materials, same calendar of failures.
Sewer demand follows the founding map: the districts built first, around the old centre and out through Hartford, hold the jointed clay and iron; the growth rings hold plastic with decades in hand. 38.9% of the metro's homes stand on the founding side of that line, which is why the footage here so often shows a pipe at the end of its story.
Every pipe material carries a lifespan, and pipe services are how a house changes generations. Sectional repair buys time on a sound system; full repiping retires a tired one, replacing choked or pitting lines wall by wall and leaving the household with pressure and water quality it may not have had in years.
A repipe decision in Norwich–New London is usually made at a kitchen table, from three exhibits: the water's behaviour at the taps, the count of repairs already paid for, and the material visible wherever the system shows itself. Exhibits like those persuade because they are the household's own. The work itself, when it comes, is less disruptive than its reputation — modern lines route through attics, closets and chases, water stays on for most of the project, and the plaster sacrificed is measured in patches, not rooms. What the household buys back is the thing the old material had been taxing away: pressure, clarity, and the right to forget the pipes exist. In Norwich–New London that holds across 62 ZIP codes, from New Haven out to New Britain.
Pipe work divides by era in this metro with unusual neatness: renewal conversations in the 82,100 pre-1980 homes, sectional repairs in the middle ring, and near-silence from the 17,099 post-2000 homes whose lines are still young. A call from West Hartford can sit in any of the three bands; the home's build year says which before the door opens.
Emergencies in Norwich–New London are answered by local independents, not a dispatch centre: PlumbReach USA routes the call, and the stock it serves — 125,728 homes across 62 ZIP codes — is the stock this page profiles.
Norwich–New London's drains are cleared by local independents who work this stock weekly: a median build year of 1969 means most lines they open have decades of history in them, and the clearing approach is chosen for the era, not the postcode.
Water Heater Repair & Installation in Norwich–New London
From New Haven to West Hartford, the heater question is the same — repair the unit or renew it — and the honest answer starts from its age against Norwich–New London's demand record, which this page sets out.
A creeping meter in a Norwich–New London home is located, not guessed at: the professionals routed here trace the line with instruments and confirm the spot before any floor or wall is opened.
Toilet Repair & Installation in Norwich–New London
Running, rocking or refusing — in Norwich–New London the diagnosis is the same short sequence: fill valve, flapper, supply line, flange. The plumbers routed here carry the internals for the fixtures this metro's eras installed.
Faucet, Fixture & Garbage Disposal Repair in Norwich–New London
Fixture work in Norwich–New London divides by era like everything else on this page: washer-era taps in the older districts, cartridge internals in the post-2000 subdivisions — the local plumber stocks for both.
Two patterns generate most of the bookings behind the services above: Ageing cast iron sewer lines and galvanized pipes at the end of their life. That is why the order of this page's service list is what it is — the services answering those patterns come early, and the rest follow in the order the metro's data supports. A homeowner whose home matches the local profile — built in the metro's big decades, in one of its older districts — is, statistically, reading their own shortlist.
From problem to fixed, in Norwich–New London
PROBLEMA plumbing problem inside a Norwich–New London home
➔
SOLUTIONThe same system in Norwich–New London after professional repair
Areas covered in the Norwich–New London metro
New Haven
Population 132,893
Hartford
Population 119,970
New Britain
Population 73,301
West Hartford
Population 63,809
Meriden
Population 60,418
East Hartford
Population 50,798
Middletown
Population 47,646
Norwich
Population 39,992
Manchester
Population 36,561
Newington
Population 30,551
East Haven
Population 27,729
New London
Population 27,199
Also in the Norwich–New London metro: Wethersfield (population 27,180), North Haven (population 24,177).
Beyond New Haven itself, the metro takes in Hartford (119,970 residents), New Britain (73,301) and the rest of the communities in the grid above — each plumbed in its own building era, which is why two streets in the same metro can need entirely different plumbing conversations. The ZIP list below is the full coverage footprint: if your code is on it, this page was written about your housing stock.
The map continues: West Hartford (63,809), Meriden (60,418), East Hartford (50,798), Middletown (47,646), Norwich (39,992). Different names, different decades — each community in Southeastern Connecticut Planning Region was plumbed in its own growth years, which is why two streets in the same metro can need entirely different plumbing conversations. The ZIP list below is the working definition of coverage; the housing behind each code is the working definition of the job.
New Haven (132,893 residents) anchors the metro, and Hartford (119,970) is its second centre of gravity. Between them they hold the bulk of the 114,577 households — and, not coincidentally, the bulk of every housing era this page discusses, from the pre-1960 core to the newest subdivisions. New Britain (73,301) and the communities beyond it repeat the same eras at smaller scale.
Draw the metro by its paperwork and it resolves into Southeastern Connecticut Planning Region — 1 jurisdictions sharing one housing stock and one weather system. Southeastern Connecticut Planning Region County holds the historic centre and the densest share of the older homes; the surrounding counties hold the rings of growth around it. Permits and inspections follow those boundaries even though water never does, which is part of why the plumber this page connects you to works these streets specifically.
Beyond the metro line, the nearest covered metros are Hartford, CT (24 miles away), New Haven, CT (40 miles) and Waterbury, CT (51 miles) — separate pages, separate profiles, because their housing and weather records are their own. Homeowners near the boundary sit between two datasets; the ZIP list above, not the map's edge, decides which page was written about your stock.
The region around Norwich–New London is a set of variations on its theme: Hartford, CT, 24 miles off, runs a median build year of 1967 on a metro population of 1,171,426; New Haven, CT (40 miles) medians 1963 on 578,741; Waterbury, CT (51 miles) medians 1969 on 463,349. Nearness is not sameness — a few decades of median build year separate their plumbing as surely as the miles separate their maps.
Count the metro per unit of itself: 2,028 housing units per covered ZIP code; 114,577 households per county; 14 communities sharing 1 county governments. Then weigh the generations against each other — 4.8 older homes for each newer one — and the service pattern on this page stops being a list and becomes a proportion: that much of the diary written by ageing systems, the rest by young ones wearing in.
The Norwich–New London record in one line — median home age: 57 years · owner-occupied homes: 74,933 · renter-occupied homes: 39,644 · pre-1960 homes per covered ZIP code: 789 · heating-to-cooling degree-day ratio: 9.08 · average rainfall: 998 mm a year.
Norwich–New London plumbing questions
Which neighbourhoods and ZIP codes does PlumbReach USA cover in Norwich–New London?
Coverage follows the metro's own map: 62 ZIP codes across Southeastern Connecticut Planning Region, anchored on New Haven and running out through Hartford, New Britain and West Hartford. The list printed on this page is the working boundary — inside it, one call routes you to an independent local plumber who serves your street. The weight of it sits where the metro does: New Haven alone holds 47.6% of the metro's residents, and the coverage follows the housing from there outward, era by era. Coverage questions come back to the same evidence: the housing counted in Southeastern Connecticut Planning Region, the 17,099 homes built since 2000 at the edge and the older core alike — one footprint, printed in full above. The ground inside that boundary holds 125,728 housing units — 48,908 from before 1960, 33,192 from 1960-1979, 17,099 since 2000 — under the climate record kept at GROTON NEW LONDON AP, CT US. Stated as a list of codes: the codes run 06226, 06280, 06360, 06475 and 06374 among the 62 on the list, spread over Southeastern Connecticut Planning Region.
My Norwich–New London home was built around 1969. What plumbing should I be watching?
Age shows in a predictable order here. Supply lines and shutoff valves from the the 1960s tire first, then drain joints, then the fixtures themselves. Norwich–New London's figures explain the queue: a median build year of 1969 means half the metro's homes are older than yours or the same age, all ageing on the same schedule. The pattern matters more than any single fault — sequential leaks in the same material are the classic signal. In Norwich–New London that plays out across 62 ZIP codes, from New Haven to Hartford. The same watch-list runs metro-wide: from Hartford (119,970 residents) to New Britain (73,301) and West Hartford, across Southeastern Connecticut Planning Region, the 82,100 pre-1980 homes share the materials this answer describes — which is why a neighbour's leak two streets away is worth a homeowner's attention here. The metro context is worth holding onto: 38.9% of the stock predates 1960, and the districts around Hartford and New Britain hold much of it — your home's neighbours are ageing on the same timetable. Set against the climate that works on them — 5,521 heating degree days, 608 cooling degree days, 39.31 inches of rain at GROTON NEW LONDON AP, CT US — the era of a Norwich–New London home is the strongest single clue to the condition of its plumbing. Where the watching happens, in figures: the community ledger reads New Haven (132,893 residents), Hartford (119,970), New Britain (73,301), West Hartford (63,809) and Meriden (60,418), out of 279,025 residents metro-wide — one timetable of ageing systems across all of them.
Which single pattern causes the most callouts in the Norwich–New London metro?
On this metro's housing and climate numbers, the pattern at the front of the queue is ageing cast iron sewer lines. Cast iron's failure is chemical before it is mechanical. It leads this page's problem list for the same reason — the sections above rank every pattern by the data behind it, with the signs that tell a watch-and-wait issue from one to act on today. The backdrop is the same metro-wide: 125,728 housing units working against the GROTON NEW LONDON AP, CT US climate record. Homeowners near New Haven meet this pattern first; the subdivisions past New Britain meet it later, as their stock reaches the same age — the queue is set by the building map, not by chance. Homeowners comparing notes across the metro — New Haven (132,893 residents), Hartford (119,970), New Britain (73,301) — are comparing the same ranked list, because the ranking was run on all 62 ZIP codes at once. The inputs behind the ranking, era by era: the era ledger reads 48,908 homes before 1960, 33,192 from 1960-1979, 26,529 from 1980-1999 and 17,099 since 2000 — 125,728 units, 114,577 households, 65.4% of them owner-occupied.
Is Norwich–New London's climate hard on pipes, or is that just something plumbers say?
Directly. The long-term normals at GROTON NEW LONDON AP, CT US — 5,521 heating degree days, 608 cooling degree days, 39.31 inches of precipitation in an average year — set the local plumbing calendar: freeze risk for exposed lines in the cold stretch, heavy heater and drain loads through the hot months, and soil that swells and shrinks between seasons, which buried lines feel before anything else does. The figures behind that answer, from the station record: a yearly average of 51.4 degrees, 39.31 inches of precipitation, 1.8 days at 90 or above and 107.2 nights at freezing or below — the four numbers this page's seasonal section is built from. It is the same story from Hartford to New Britain — the stock decides, and this stock's median build year is 1969. That is the metro-wide version; the household version differs by exposure — a shaded lot in Hartford, an open slab in New Britain (73,301 residents), a crawl space in West Hartford — but the loads themselves, 5,521 heating degree days against 608 cooling, are the same sky over every roof in Norwich–New London. The figures are worth keeping with the house papers: 51.4 degrees as the yearly average at GROTON NEW LONDON AP, CT US, 39.31 inches of precipitation, and a housing stock whose median year is 1969 — the three numbers this metro's plumbing lives by. That load lands on 114,577 households across Southeastern Connecticut Planning Region — 38.9% of their homes predate 1960, a median build year of 1969 — which is why the climate section of this page is arithmetic, not atmosphere. Whose roofs that weather works on: the community ledger reads New Haven (132,893 residents), Hartford (119,970), New Britain (73,301), West Hartford (63,809) and Meriden (60,418), out of 279,025 residents metro-wide.
A line has let go somewhere in my Norwich–New London house and water is spreading. What happens first?
The first five minutes belong to one valve. Find the main shutoff (meter box at the street for many Norwich–New London homes, an interior valve for others), close it, then open a low faucet so the broken line empties into a drain instead of a wall. Photograph the damage for your records once the water stops, keep clear of any electrics the water has reached, and then call — in that order. Across the metro's 1 counties, Southeastern Connecticut Planning Region County included, the pattern repeats wherever the housing matches. The local detail that decides how the first minutes go: which side of Norwich–New London the home sits on. Houses in Hartford and the older districts tend to shut off at an interior valve; slab homes out toward New Britain and West Hartford more often at the meter — worth knowing before the water is moving, across all 62 covered ZIP codes. The calm-day homework for this metro: walk the 62 covered ZIP codes' worth of housing in your mind to your own valve — in Southeastern Connecticut Planning Region County the older stock hides it indoors, the slab tracts past New Britain at the meter — and turn it once before you ever need it in anger. The calm-day version, localised: find your valve before GROTON NEW LONDON AP, CT US's next freeze season — 107.2 freezing nights a year — whether your home sits near New Haven, out in Hartford (119,970 residents) or past New Britain (73,301). True from the centre to the edge: the community ledger reads New Haven (132,893 residents), Hartford (119,970), New Britain (73,301), West Hartford (63,809) and Meriden (60,418), out of 279,025 residents metro-wide — shutoff first, everywhere on the map. For the record of the call: the Norwich–New London–Willimantic metro, 279,025 residents, 65.4% of its homes owner-occupied, a median build year of 1969. Learn it street by street if you must: the 06475 subdivisions shut off at the meter, the 06374 districts at the wall, the oldest homes out toward 06235 at a curb stop — the map of valves is the map of build decades.
When does a Norwich–New London house cross the line from repairs to a full repipe?
Age alone convicts nobody — there are the 1960s copper systems in this metro that will outlast their owners. What convicts a system is repetition inside one material: leak, repair, leak elsewhere, repair, pressure falling the whole time. Norwich–New London's older districts produce that story often enough that the repipe question is routine here, but the answer is still earned house by house, from the evidence in the walls. Homeowners in Hartford (119,970) and New Britain (73,301) read this page for the same reason — the stock there is the same stock. The numbers are the metro's own: 114,577 households, 62 ZIP codes, one climate record at GROTON NEW LONDON AP, CT US. The pattern is not evenly spread: it concentrates in the 82,100 pre-1980 homes, thickest in the founding districts and the first suburbs — the streets around Hartford and the old core — and thins toward West Hartford and the growth edge, where the stock is a generation younger. The evidence standard is the same across Southeastern Connecticut Planning Region: in the 48,908 pre-1960 homes the bore of a cut section settles it; in the 1960-1979 ring — 33,192 homes — the sequence of leaks settles it. Streets carry the same ledger at household scale: from New Haven (132,893 residents) through Hartford (119,970) to New Britain (73,301), the leak sequence means the same thing wherever the material matches. Where the conversations happen: the community ledger reads New Haven (132,893 residents), Hartford (119,970), New Britain (73,301), West Hartford (63,809) and Meriden (60,418), out of 279,025 residents metro-wide, earliest and oftenest in the founding names on that list.
Does PlumbReach USA employ the plumbers it sends out in Norwich–New London?
You are hiring the local plumber; PlumbReach USA is the switchboard and the library. The switchboard part routes your call to an independent professional serving Norwich–New London. The library part is this page — the metro's housing and climate homework, published so the call you make is an informed one. The wrench work, the scheduling and the responsibility for the job itself all belong to the professional who takes it on. The local figures behind it: 82,100 homes from before 1980 and 17,099 built since 2000, sharing one system of streets and soil. The arrangement is the same across the whole footprint: 62 ZIP codes, 1 counties, communities from New Haven through West Hartford — in each of them the professional is local, independent, and working their own patch of the metro's housing. The same plain statement covers the whole metro, from the core around New Haven to the edge past New Britain: information and routing from us, the work and everything that follows from it from the independent professional you hire. Callers from Hartford (119,970 residents), New Britain (73,301) and West Hartford get the same plain arrangement: our routing, their plumber, their terms — stated here because the metro's 279,025 residents deserve it stated. The arrangement holds in every community: the community ledger reads New Haven (132,893 residents), Hartford (119,970), New Britain (73,301), West Hartford (63,809) and Meriden (60,418), out of 279,025 residents metro-wide.
What plumbing checks are worth doing each year in Norwich–New London?
One page of a notebook, kept yearly. On it: the shutoff, turned and confirmed. The heater, drained and its age noted against the plate. The meter, read twice on a quiet evening. The cleanout, glanced down. The ground-floor drains, run full for a minute each. In Norwich–New London — median build year 1969, 1.8 hot days, 107.2 freezing nights — that single page, repeated annually, is the difference between meeting your plumbing on your schedule and meeting it on its. None of it is abstract at this scale: 114,577 households across Southeastern Connecticut Planning Region share one climate and one ageing stock, so a yearly rhythm kept by even a fraction of them is the difference between this metro's plumbing failing in private, one house at a time, and failing on a schedule somebody saw coming. The checks travel well because the conditions do: GROTON NEW LONDON AP, CT US's record covers Hartford, New Britain and West Hartford alike, and the housing eras repeat across all 62 ZIP codes. A neighbour in another district keeping the same calendar is not copying you; they are reading the same data. The calendar's local proof is in the stock figures: 82,100 pre-1980 homes to keep valves alive in, 17,099 post-2000 homes reaching first-fixture age together, and 39.31 inches of rain a year testing every cleanout in Southeastern Connecticut Planning Region. The checks are sized to the stock's actual eras — a median build year of 1969, 38.9% of it pre-1960 — not to a generic house that exists nowhere in Norwich–New London. The routine's stock, counted: the era ledger reads 48,908 homes before 1960, 33,192 from 1960-1979, 26,529 from 1980-1999 and 17,099 since 2000 — 125,728 units, 114,577 households, 65.4% of them owner-occupied.
Why does this page lead with the problems it leads with in Norwich–New London?
By scoring, from two public records. The Census housing data says what Norwich–New London's homes are made of and when they were built; the NOAA climate record says what the weather loads onto them. Patterns that both records support rank highest, and the evidence paragraphs in each section show the working. Nothing in the order comes from a national template — the template is the scoring, and the scores are Norwich–New London's alone. Run the same scoring on any single district and the order bends: Hartford's streets would rank their own list, West Hartford's another. This page ranks the metro as a whole — 114,577 households across Southeastern Connecticut Planning Region — which is why the evidence paragraphs keep returning to where each pattern actually concentrates. The sort is re-run from the data, not inherited: 38.9% pre-1960 stock, 65.3% pre-1980, 1.8 hot days against 107.2 freezing nights — the weights are this metro's, so the ranking is. The evidence trail is on this page: the problem sections scored pattern by pattern, the housing profile drawn from Southeastern Connecticut Planning Region, the climate read from GROTON NEW LONDON AP, CT US — the ranking is the two records read together, nothing else. The scoring's raw material, community by community: the community ledger reads New Haven (132,893 residents), Hartford (119,970), New Britain (73,301), West Hartford (63,809) and Meriden (60,418), out of 279,025 residents metro-wide. Run the identical scoring next door and the order shifts: Hartford, CT, 24 miles away, keeps its own list; New Haven, CT, 40 miles, another; Waterbury, CT, 51 miles, a third — proximity is not sameness. The sort ran over the whole list — from 06226 and 06280 through 06360, 06475 and 06374 to 06235 — and returned one order for all of it, because the inputs were the metro's totals, not any single district's.
Which Norwich–New London neighbourhoods sit on the metro's oldest pipes?
The oldest homes cluster where the metro began: the historic core around New Haven and the first suburbs out from it, where the 48,908 pre-1960 homes in this metro mostly stand. It matters because era is destiny for plumbing — those streets hold the cast iron, the galvanized steel and the clay laterals this page's problem list is built from. The newer districts around Hartford hold younger systems with younger problems: fewer material failures, more wear and installation questions. It is also a numbers story: of Norwich–New London's 125,728 housing units, the pre-1960 share is 38.9% — the largest single concentration of original-era pipework in the metro, sitting in the districts where Southeastern Connecticut Planning Region County's streets were laid out first. Concentrations, for the record: the oldest systems sit inside the 48,908 pre-1960 homes, and those homes cluster — the founding core, the streetcar-era streets, the first suburbs in Southeastern Connecticut Planning Region County — rather than scattering evenly across the 62 covered ZIP codes. It is why two homes a mile apart in Norwich–New London can need different conversations: one on the 1960s materials near the centre, one on modern lines past New Britain — the map of eras is the first diagnostic. ZIP by ZIP the same gradient: the oldest systems cluster in the codes nearest the centre — the 06226 side of the list — and the youngest toward 06475 at the edge, across Southeastern Connecticut Planning Region. The map's communities in growth order: the community ledger reads New Haven (132,893 residents), Hartford (119,970), New Britain (73,301), West Hartford (63,809) and Meriden (60,418), out of 279,025 residents metro-wide. Counted under its Census name — the Norwich–New London–Willimantic metro, 279,025 residents, 65.4% owner-occupied — the oldest layer is a defined population of homes, not a figure of speech.
What should a yearly plumbing check in Norwich–New London actually include?
Read the findings other local homeowners get and a pattern assembles: valves stiff from disuse, anode rods spent in heaters older than their protection, supply lines in the material the the 1960s installed, traps dry in little-used bathrooms. A check in Norwich–New London is essentially a census of those four, taken one house at a time — which is why the walk is standardised: the stock keeps returning the same answers, and the value lies in hearing them early. Scale the walk to the metro and its importance grows: 114,577 households, a median build year of 1969, 39.31 inches of rain a year pressing on the buried half of every system. The check is thirty minutes in one home; multiplied across a stock like this, it is the difference between the metro's failures arriving as surprises and arriving as appointments. District by district, the same half hour: in Southeastern Connecticut Planning Region County's oldest homes the flags are materials; in the middle ring, around Hartford (119,970 residents), they are valves and heaters; at the growth edge they are cartridges and first questions about lines under slabs. Keep the findings with the house records: in a metro of 114,577 households, the homes whose owners can date their last check are the ones whose failures arrive as appointments — the entire point of the half hour. The walk, scaled: 125,728 homes, 82,100 of them pre-1980, a median year of 1969, a climate of 5,521 heating degree days and 39.31 inches of rain at GROTON NEW LONDON AP, CT US — the shortlist is those numbers, interviewed one house at a time. The walk's territory, in codes: the codes run 06226, 06280, 06360, 06475 and 06374 among the 62 on the list, spread over Southeastern Connecticut Planning Region.


 PROBLEM
 SOLUTION