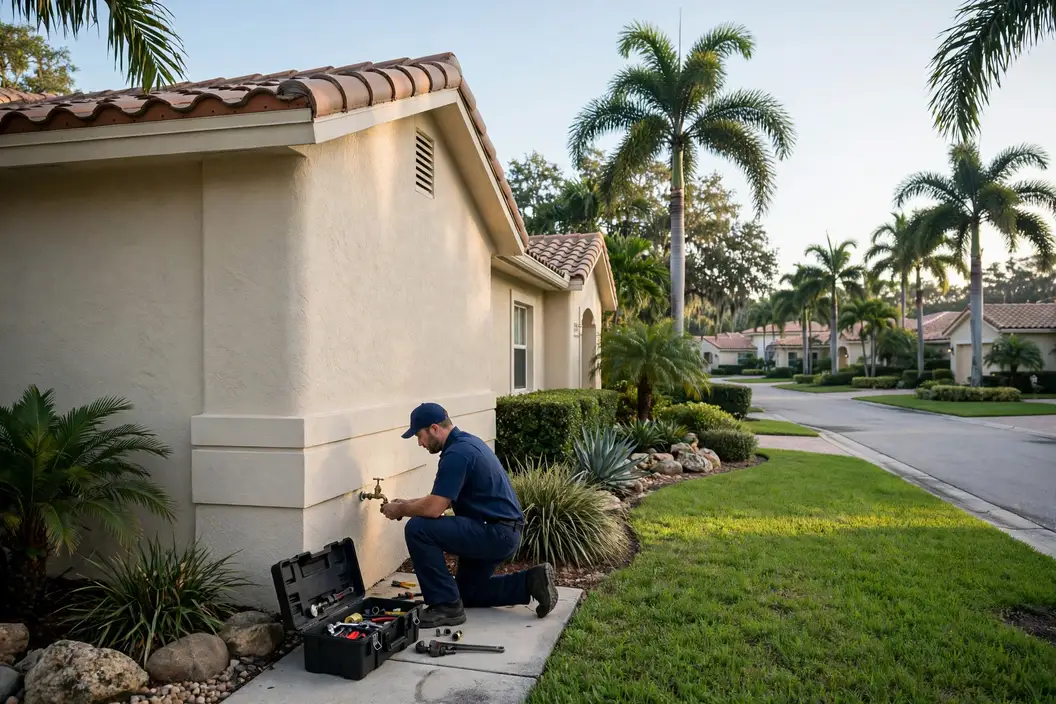


A metro's plumbing is a portrait of its building history under its weather, and Naples's portrait is painted below from its own records: Census housing figures, NOAA climate normals, the metro's ZIP codes and communities. PlumbReach USA's role is the connection to a local professional; the portrait is here so that connection starts from understanding rather than urgency.
Call center hours: Mon-Fri 7:00 AM-10:00 PM ET | Sat 8:00 AM-10:00 PM ET | Sun 7:00 AM-9:00 PM ET
The median Naples home was built in 1996; 16.8% of the stock predates 1980, and the pattern this metro's own data ranks first is slab leaks under concrete foundations. PlumbReach USA is a referral service, not a plumbing company: one call connects you with an independent local plumber serving your ZIP code.
Naples is a metro of 387,681 people and 160,867 households, and its plumbing is a portrait of its building history. The median home here was built in 1996; 16.8% of homes predate 1980 and 1.5% predate 1960, while 39.8% have arrived since 2000. Every one of those eras plumbed differently — different pipe materials, different drain designs, different fixtures — and they fail differently, which is why this page is organised around the patterns the data actually produces in Naples rather than plumbing in the abstract.
Count the older stock by its materials and the metro's maintenance burden comes into focus: iron and clay drains by the tens of thousands of homes, galvanized and early copper supplies in the same walls, fixtures from the first age of mass production still serving in bathrooms across Collier County. None of it failed yesterday; all of it is ageing on schedule together. A homeowner in that stock is not unlucky — they are on time, in a district where the systems were always going to need their generation of attention at once.
Growth wrote this metro's newest plumbing chapter in plastic and concrete: supply and drain lines in modern materials, fixtures by the catalogue, foundations poured as slabs across the subdivisions near Naples and Marco Island. The chapter is young — its systems have decades in hand — but it is not exempt from the metro's arithmetic: 4,136 cooling degree days of demand work its heaters hard, and the soil under its slabs moves with the same seasons as the soil under the oldest farmhouse in Collier County.
Over the housing sits one more dataset, the sky's: 230 heating degree days and 4,136 cooling degree days in the average year at EVERGLADES CITY 5 NE, FL US, an average temperature of 75.7 degrees, extremes at both ends faithfully recorded. A metro's plumbing is designed — to the extent it is designed at all — for the middle of that record, and it fails at the record's edges. What follows is a page about the edges: the cold snaps, the storm weeks, the long hot stretches, and the systems they find first.
Housing eras and climate, joined — the two datasets every section of this page is built from.
The distribution, in one breath: of every hundred Naples homes, 1.5 were standing before 1960, 15.3 went up in the two decades after, 43.4 in the two after that, and 39.8 have arrived since 2000. Percentages flatten the picture, so hold the counts beside them — 3,521 oldest-era homes, 93,423 newest — and the metro's plumbing stops being an abstraction: it is that many systems, of those ages, failing in that order.
This metro's stock was mostly built in plumbing's transitional decades, 1980 to 1999, and it shows a particular failure calendar: not the corrosion sagas of the old metros, but the wear-out wave of everything installed in those years arriving together — cartridges, heater tanks, fixture finishes, the first of the plastic systems ageing into brittleness. Naples's plumbing story for the next decade is largely written: it is the story of that installed base reaching its limits neighbourhood by neighbourhood.
The second-largest band is the newest: 93,423 homes built since 2000, 39.8% of the metro. Young stock writes young plumbing — heater waves, cartridge waves, the first slab questions — arriving street by street as uniform subdivisions age in lockstep around Naples and the growth edge. It is the metro's future workload, visible early to anyone reading the table.
No profile of this metro is complete without its extremes, because plumbing meets the extremes, not the averages. The average year at EVERGLADES CITY 5 NE, FL US — 75.7 degrees, 55.28 inches of precipitation — is a statistical resident of a metro nobody lives in. The lived version is the coldest night of January against an uninsulated run, the storm week that saturates the soil over every lateral, the August stretch that works heaters and drains without a pause. The numbers in this section are the averages; the problems ranked below are the extremes, translated.
Hold the two halves together and the rest of this page explains itself: the problems ranked highest here are the ones where Naples's dominant housing era and its climate record overlap. Change either dataset and the ranking changes — which is precisely why this profile is rebuilt from the records for every metro instead of carried over from the last one.
Selected and ranked from this metro's housing-age profile and climate record — not copied from another city's page.
A slab home keeps its secrets under concrete. The supply lines run beneath the floor, and when one begins to leak — worked by soil movement, chafed where it passes through the slab, thinned by decades of hot water — the evidence surfaces everywhere except at the leak: a meter that turns with every tap closed, a patch of floor warm to bare feet, a water bill that climbs without a change in the household's habits. Left alone, the leak undermines the soil the slab rests on and feeds moisture into flooring from below. Finding it is a listening exercise: acoustic equipment traces the sound of escaping water through the concrete to a single point, so the floor opens once, in the right place.
Once a slab leak is located, the repair decision turns on geometry. Opening the floor at the marked point reaches the failed section directly and restores the original run — a good answer when the line is otherwise sound and the spot sits under replaceable flooring. Rerouting abandons the buried run entirely and carries the water through walls and ceiling instead — a better answer when the line has form, when several runs share the slab, or when the floor above is worth more than the pipe below. Plumbers in Naples argue both sides of that choice daily; the honest version depends on the leak's position, the line's history, and what the floor is made of.
The local denominator matters: 93,423 of the metro's homes went up since 2000, most on slabs, most with lines beneath them. Even a small failure rate across that many buried runs produces a steady stream of leaks — and the stream is young, because those lines are only now reaching the age where soil movement and hot-water cycling start their work.
A tank heater is a vessel that cooks its own lining. Every heating cycle precipitates minerals out of the water, and they settle on the tank floor as sediment — an insulating blanket that makes the burner or element work longer, rumbling as steam pockets form and collapse beneath it. Meanwhile the anode rod, installed to be corroded in the steel's place, quietly spends itself. When it is gone, the tank itself is next. The pattern is universal, but the pace belongs to the local water and the local climate: the harder a metro heats and the more hot water its households draw, the sooner the rumble, the rust-tinged water and the puddle at the base arrive to announce the end of a heater's service.
Recovery time is the number that runs a household's mornings, and it is the first thing sediment steals. A tank rated to serve a family when new delivers less hot water per heating cycle every year as the sediment layer thickens and the burner's work goes into heating rock instead of water. In Naples, where summer demand piles showers, laundry and dishwashing into the same hours, that slow decline shows up as a household quietly rationing hot water without ever deciding to. Flushing the tank returns some of it; a spent anode and a rumbling, scaled tank are the signs the decline has become structural, and the conversation turns to replacement.
Scale the workload: 160,867 households, each cycling a tank through chores, showers and laundry, under a climate that loads the system at both temperature extremes across the year. Tank failures distribute across that base like weather — individually unpredictable, collectively as regular as the seasons that drive them.
Galvanized pipe does not fail loudly; it fails by narrowing. Zinc coating gone, the steel rusts from the wet side, and every year the passage water travels through is a little smaller than the year before. The household reads it as personality — the shower that weakens when a tap opens, the washing machine that fills slowly, the rust tinge after a holiday — until the day a pinhole opens in a wall and the personality becomes a flood. In housing built when galvanized was simply how houses were plumbed, the whole system is one age and one material, which is why the faults stop being isolated: the pipe is not breaking in one place, it is finishing in all of them at the same pace, and the repair conversation has to reckon with that arithmetic.
Galvanized pipe fails politely, which is precisely the problem. No flood, no drama — just a shower that weakens across years, a washing machine that fills slowly, water that blushes rust after holidays. Households adapt without noticing, the way you adapt to a dimming bulb. The 35,914 homes built in this metro between 1960 and 1979 stand in the front of that queue now, their original steel bores narrowed to drinking-straw width in the worst runs. The fix, when it comes, tends to astonish people — not with its scale, but with the pressure they had forgotten they were owed.
The replacement side of the ledger is equally local: when a Naples home of the galvanized era is sold, inspected or renovated, the supply lines are among the first systems examined — because everyone in the local trade knows the material's age here. A pattern the whole market has learned to look for is not an anecdote; it is the metro's housing data wearing a tape measure.
When a storm system pushes through Naples, the plumbing load arrives as water: saturated ground pressing on laterals, storm runoff testing every joint, and households running everything at once once the weather clears. The homes that ride the season out well are the ones whose drains were clear before it started — a line at half capacity in June is a backup in September.
The season's measure at EVERGLADES CITY 5 NE, FL US is 55.28 inches of rain in an average year, with the storm months capable of delivering a season's worth in days. Naples's laterals — the generations-old runs under Golden Gate and the old core most of all — carry the surge, and the backups of storm season are written in that arithmetic.
Consider where the water goes. A supply line pierced under a slab does not announce itself in the room above; it irrigates the ground the house stands on, sometimes for a season, and the house reports it sideways — flooring that cups, a baseboard that darkens, a gas bill that climbs as the heater feeds the leak's appetite for hot water. Naples's slab-built stock — the tracts around Golden Gate and the 93,423 homes poured since 2000 — holds this risk in common: same design choice, same concealment. The metro's older pier-and-beam homes leak too, but they leak visibly, into crawl spaces, where a flashlight finds them. The slab keeps its secret until somebody goes listening for it.
Strip the pattern down to its inputs and the ranking stops being mysterious: 160,867 households drawing on systems installed across a median build year of 1996, in a climate that swings between 157.7 days of serious heat and 0.8 freezing nights. Whatever pattern a metro with those inputs manufactures most, it manufactures here — the lead position is less a title than a consequence, recalculated from the same public records any sceptic can check.
The first visit follows a short, diagnostic list — each item ruling a branch of the problem in or out:
Listed in the order this metro's housing and climate data supports.
Water travels, so the stain is seldom above the leak. Detection work pairs listening equipment and pressure testing with old-fashioned tracing to fix the source's position before anything is opened — then the repair happens through the smallest honest hole, not an exploratory trench.
Leaks in Naples are worth finding precisely because the metro's housing stock is mixed. Lines from the 1990s run beside lines installed last year; some are copper, some galvanized at the end of its life, some plastic. A stain on a ceiling in an older Collier County home might be a pinhole two rooms away, travelling along a joist — the pattern detection exists to prevent, where the wall is opened three times and the leak is in none of them. One marked spot, one opening, and a pressure test afterwards to prove the loss has stopped for the whole system. Count it in homes if you prefer: 39,435 built before 1980, 93,423 since 2000, one shared system of soil and seasons.
The search territory is the metro's whole stock: 93,423 homes built since 2000, most of them hiding lines under slabs, against 39,435 pre-1980 homes hiding theirs in walls and crawl spaces — detection in Naples and detection in the subdivisions are different hunts for the same missing water.
Everything hot in a house — showers, laundry, dishes — passes through one tank, which is why its failures empty the whole routine at once. Servicing covers the wearing parts and the safety valve; installation work sets its successor up level, vented, drained and strapped, ready for its own decade of mornings.
Stand in a Naples street and count rooflines and you are also, roughly, counting water heaters by age. The subdivisions went up in waves and their tanks were fitted in the same weeks, so the metro's heater fleet ages in convoys — quiet for years, then a whole street replacing within a few seasons. The pre-1980 districts run a different rhythm, individual tanks on individual schedules inside older plumbing. Both rhythms end at the same judgement, made on evidence rather than birthdays: the tank's condition, its repair history, and the household's patience for cold showers while the argument settles. Locally the workload concentrates where the stock is oldest — the districts built around the 1990s first.
The arithmetic behind the diary: 160,867 households heating water through 4,136 cooling degree days and 230 heating degree days a year — every one of those households a tank ageing on the same climate's schedule, from the pre-war homes to the newest builds around Lely Resort.
Pipes fail in two tenses: suddenly, at a joint or a split, and gradually, as a material narrows, thins or pits across a whole system. The first tense asks for a repair; the second eventually asks the larger question. Pipe services cover both — the sectional fix that restores a sound system, and the planned renewal that replaces a failing material through the whole house, routed to spare the building and staged to keep the household in water.
Pressure is the pipe system's public voice, and in Naples it speaks with a district accent. In the pre-1980 districts — 39,435 homes — it fades year by year as galvanized bores narrow, a decline so gradual that households adapt to it fixture by fixture and only notice when a visitor's shower puts theirs to shame. In the newer subdivisions it stays loud and even. The repair-or-renew decision is usually just a translation of that voice: a system whose pressure is leaving has delivered its diagnosis already, and the assessment visit exists to confirm it in person. From Naples to Marco Island, the pattern repeats wherever the housing era matches.
Pipe work divides by era in this metro with unusual neatness: renewal conversations in the 39,435 pre-1980 homes, sectional repairs in the middle ring, and near-silence from the 93,423 post-2000 homes whose lines are still young. A call from Pelican Bay can sit in any of the three bands; the home's build year says which before the door opens.
Emergencies in Naples are answered by local independents, not a dispatch centre: PlumbReach USA routes the call, and the stock it serves — 234,732 homes across 22 ZIP codes — is the stock this page profiles.
Naples's drains are cleared by local independents who work this stock weekly: a median build year of 1996 means most lines they open have decades of history in them, and the clearing approach is chosen for the era, not the postcode.
The line from house to street in Naples crosses soil that this climate wets and dries in rotation; sewer services here are scoped by camera first, so the repair matches the footage rather than a guess.
In Naples, a toilet that runs all night is a water bill with a sound; the local service replaces the tired internals and checks the flange and supply while the tank is open.
In Naples the faucet call is often the first plumbing visit a newer home ever gets — the professionals routed here treat it as an introduction: the fixture fixed, and the home's shutoffs and heater age noted for the record.
There is a plainer way to say what this page's ranking means in practice: most calls in Naples are two calls. The first answers Slab leaks under concrete foundations; the second answers water heaters working hard year-round. Between them they account for the shape of a local plumber's week here — the districts visited, the parts stocked, the diagnoses made fastest because they are made most often. The remaining services divide the rest of the diary among them, essential but episodic, the supporting work around two leading patterns.
 PROBLEM
 SOLUTION
Population 28,767
Population 19,421
Population 15,998
Population 8,296
Population 6,826
Population 6,575
Population 5,377
Population 5,262
Population 4,995
Population 3,770
Population 3,484
Population 2,931
Also in the Naples metro: Island Walk (population 2,724), Pelican Marsh (population 2,513).
The communities in the grid are not suburbs of the page; they are its subject as much as Golden Gate is. Naples (19,421 residents) and Marco Island (15,998) carry their own building decades, their own pipe materials and their own positions in the problem ranking's logic — a lateral under a Naples street answers to the same data as one in the centre, but to a different era of it. Coverage here is defined by the ZIP list below; understanding is defined street by street, and this page's figures are the metro-wide version of a story each community tells in its own numbers.
The map continues: Lely Resort (8,296), Ave Maria (6,826), Pelican Bay (6,575), Orangetree (5,377), Naples Manor (5,262). Different names, different decades — each community in Collier was plumbed in its own growth years, which is why two streets in the same metro can need entirely different plumbing conversations. The ZIP list below is the working definition of coverage; the housing behind each code is the working definition of the job.
Golden Gate (28,767 residents) anchors the metro, and Naples (19,421) is its second centre of gravity. Between them they hold the bulk of the 160,867 households — and, not coincidentally, the bulk of every housing era this page discusses, from the pre-1960 core to the newest subdivisions. Marco Island (15,998) and the communities beyond it repeat the same eras at smaller scale.
Draw the metro by its paperwork and it resolves into Collier — 1 jurisdictions sharing one housing stock and one weather system. Collier County holds the historic centre and the densest share of the older homes; the surrounding counties hold the rings of growth around it. Permits and inspections follow those boundaries even though water never does, which is part of why the plumber this page connects you to works these streets specifically.
Beyond the metro line, the nearest covered metros are Cape Coral–Fort Myers, FL (47 miles away), Miami, FL (57 miles) and Punta Gorda, FL (66 miles) — separate pages, separate profiles, because their housing and weather records are their own. Homeowners near the boundary sit between two datasets; the ZIP list above, not the map's edge, decides which page was written about your stock.
Set Naples among its neighbours and the contrasts sharpen the profile: Cape Coral–Fort Myers, FL — metro population 875,607, median build year 1995 — sits 47 miles away; Miami, FL (6,391,072, median 1982) 57 miles; Punta Gorda, FL (217,212, median 1990) 66 miles. Three different housing stocks under three nearby skies, which is why each keeps its own page and its own problem ranking rather than borrowing this one.
Ratios tell the metro's story compactly. Renters occupy 24.0% of homes; owners hold the rest. For every home built since 2000 there are 0.4 from before 1980. Spread the stock across the coverage map and each ZIP code carries about 10,670 housing units — the density at which era patterns repeat street after street instead of scattering, and at which a routed round of calls stays inside a few districts.
One line of Naples arithmetic — a median home 30 years old · 122,259 owner-occupied homes against 38,608 renter-occupied · 160 pre-1960 homes for every covered ZIP code · a heating-to-cooling degree-day ratio of 0.06 · 1,404 mm of rain in an average year.
Before an emergency, read the guide: How to shut off your home's water main
Describe the problem and the call center routes you to an independent local plumber who works in the Naples metro.
Call center hours: Mon-Fri 7:00 AM-10:00 PM ET | Sat 8:00 AM-10:00 PM ET | Sun 7:00 AM-9:00 PM ET