

This is Jacksonville's plumbing page, built from Jacksonville's own numbers: Census housing figures, the metro's ZIP codes and its NOAA climate record. PlumbReach USA routes your call to an independent local plumber; the homework below is here so you know your home's likely problems before you ever make it.
Call center hours: Mon-Fri 7:00 AM-10:00 PM ET | Sat 8:00 AM-10:00 PM ET | Sun 7:00 AM-9:00 PM ET
The median Jacksonville home was built in 1997; 26.0% of the stock predates 1980, and the pattern this metro's own data ranks first is slab leaks under concrete foundations. PlumbReach USA is a referral service, not a plumbing company: one call connects you with an independent local plumber serving your ZIP code.
Every metro is really several, stacked by decade. Jacksonville's stack, per the Census, reads: 8.3% of homes from before 1960, a thick middle from the growth decades, and 45.8% from 2000 onward — 85,917 housing units in all, wrapped around a median build year of 1997. Plumbing follows the stack faithfully. Each layer went in with its era's materials and workmanship, and each layer is now failing in its era's characteristic order. This page keeps the layering in view throughout, because in a stacked metro the first diagnostic question is never what broke — it is which layer the home belongs to.
Stand in one of Jacksonville's older neighbourhoods and you are standing in its plumbing's back catalogue. The homes there — part of the 22,338 built before 1980 across this metro — went up when galvanized steel was a supply line, cast iron or clay was a drain, and a fixture was expected to serve for half a century. That half-century has now elapsed. What it leaves behind is not universal failure but universal exposure: every joint, valve and lateral in those districts is operating past the horizon its makers planned for, in Onslow County and beyond, and the failures arrive in the order the materials tire.
The post-2000 homes have a plumbing trait the older districts never had: uniformity at scale. A subdivision's lines went in within a few seasons of each other, so its first heater failures, its first cartridge failures and its first slab questions arrive within a few seasons of each other too. With 39,350 such homes in the metro, those arrivals are not anecdotes but waves, and the households who read them early — who learn their system's age and keep its number handy — meet them as maintenance rather than emergency.
The climate written over all of it comes from the NOAA station at NEW RIVER MCAF, NC US: an average year brings 2,497 heating degree days, 2,022 cooling degree days and 56.51 inches of precipitation. Those are not abstractions to a buried pipe or an exposed line — they set how often soil around a sewer lateral swells and shrinks, how hard a water heater cycles in January and July alike, and whether an uninsulated garage line is a worry or a certainty. The problem sections that follow are selected by exactly these numbers, combined with the housing-age profile above.
The metro's building eras on one side, its weather record on the other — and its plumbing where the two meet.
Lay the eras side by side instead: 8.3% pre-1960 (7,131 homes), 17.7% from 1960-1979 (15,207), 28.1% from 1980-1999 (24,143), and 45.8% since 2000 (39,350). No single era tells the story — the proportions among them do, and those proportions are different in every metro this site covers.
New-stock metros have their own signature, and Jacksonville has it in full: most homes built since 2000, most systems young, most plumbing work a matter of waves — the heater wave, the cartridge wave, the first slab questions — arriving street by street as identical subdivisions age in lockstep. The older pockets still produce the deepest single jobs, but the metro's plumbing centre of mass sits in its newest postcodes, and every year the waves get closer together.
Second in the table, the 1980-1999 band: 24,143 homes, 28.1% of the metro. Its systems are mature rather than ancient — copper in its pinhole years in places, plastic drains still sound, first-generation cartridges wearing out in waves — and its plumbing is the schedulable kind: work that rewards being booked before it becomes urgent.
Translate the climate record into plumbing terms and it comes out as three working conditions. Condition one, the freeze count — 42.7 nights a year when exposed water can solidify and split its container. Condition two, the heat count — 43.8 days that load drains, heaters and tempers simultaneously. Condition three, the water itself: 56.51 inches of it arriving from the sky to move the soil around every lateral in the metro. Jacksonville's systems are engineered, installed and aged inside those three conditions, and their failures carry the conditions' fingerprints.
A profile is only useful if it predicts something, and this one predicts the shape of a plumbing diary in Jacksonville: which streets will call about drains, which about pressure, which about heaters, and in which months. Everything after this section is that prediction written out as services, problems and answers — the numbers first, the narrative second, the way the evidence actually runs.
Ordered by what this metro's data says its homes need most.
A leak announces itself indirectly: a bill creeping up, a meter that never rests, paint blistering in a room with no plumbing. The detection visit follows those signs with instruments until the evidence converges, because repairing the wrong spot costs twice — once for the hole, once for the leak still running.
Every detection job in Jacksonville begins with a subtraction problem: the meter's total, minus everything the household can account for, equals the leak. The arithmetic is simple; the geography is not. That missing water is travelling somewhere inside a stock of 85,917 homes built across a century of methods — through slab concrete in one district, behind plaster in another, under a yard line in a third. The instruments change with the construction, but the logic never does: measure the loss, halve the search area, halve it again, and open the building exactly once, at the marked point. Count it in homes if you prefer: 22,338 built before 1980, 39,350 since 2000, one shared system of soil and seasons.
The search territory is the metro's whole stock: 39,350 homes built since 2000, most of them hiding lines under slabs, against 22,338 pre-1980 homes hiding theirs in walls and crawl spaces — detection in Piney Green and detection in the subdivisions are different hunts for the same missing water.
The supply system is a single organism, so its failures correlate. Repiping exists for the point where correlation is obvious: pressure fading, water discolouring, leaks touring the house. New runs go in PEX or copper, routed to minimise opening walls, pressure-tested before anything is closed up.
Not every old pipe in Jacksonville needs replacing, and the assessment matters: a sound copper system from the 1990s with one failed joint is a repair; a galvanized system with rust at every exposed fitting is a repipe waiting for its date. The metro's newer subdivisions (45.8% built since 2000) sit this conversation out for now — their turn comes decades from now. For the older stock, the job is planned around the household: routes through accessible spaces, water restored in stages, and openings kept to where lines actually have to pass. Ask in Holly Ridge and the answer rhymes with Jacksonville: same eras, same materials, same calendar of failures.
The repair-or-renew caseload is set by one figure above the rest: 26.0% of Jacksonville homes predate 1980, plumbed in the materials now at the end of their service lives. Around Holly Ridge (4,532 residents) as in the old core, that percentage is not an abstraction — it is the street's plumbing, house by house.
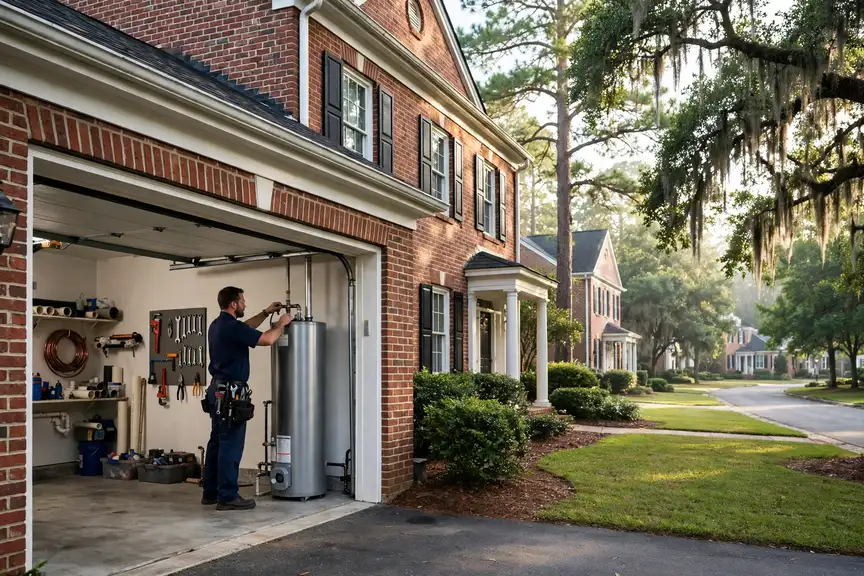
Hot water is a daily expectation so total that its absence reorganises a household within hours. Heater servicing protects that expectation: burners and elements tested, sediment drained, the safety valve exercised, the anode's remaining life judged. When the tank itself is finished, installation replaces it with a unit matched to the home's demand and venting, set up to serve the same expectation for another decade.
Stand in a Jacksonville street and count rooflines and you are also, roughly, counting water heaters by age. The subdivisions went up in waves and their tanks were fitted in the same weeks, so the metro's heater fleet ages in convoys — quiet for years, then a whole street replacing within a few seasons. The pre-1980 districts run a different rhythm, individual tanks on individual schedules inside older plumbing. Both rhythms end at the same judgement, made on evidence rather than birthdays: the tank's condition, its repair history, and the household's patience for cold showers while the argument settles. That is the daily reality for the 72,516 households spread across Onslow.
The arithmetic behind the diary: 72,516 households heating water through 2,022 cooling degree days and 2,497 heating degree days a year — every one of those households a tank ageing on the same climate's schedule, from the pre-war homes to the newest builds around Sneads Ferry.
Across Onslow, the lateral is the buried half of every home's plumbing — in Jacksonville much of it dates to the the 1990s and earlier, and the local approach is inspect, show the footage, then repair or renew the run that failed.
One call from anywhere in the Jacksonville metro — from Jacksonville out to Holly Ridge — routes to the local professional on cover; the failure patterns they expect first are the ones this page's data ranks.
Across Onslow, drain calls follow the building map: iron and clay near the old core around Jacksonville, plastic at the growth edge — one service, two different crafts, both covered by the routing on this page.
Toilet calls in Jacksonville are the small end of the diary and the most democratic: every era of the 85,917-home stock produces them, and the local fix starts with the mechanism in the tank, not the porcelain.
Drips and disposals across Onslow are small jobs with a standard: repair the mechanism where the fixture deserves it, renew it where it does not, and check the shutoffs and supply lines while the cabinet is open.
If this page's services were ranked by Jacksonville's call patterns rather than listed in catalogue order, they would come out much as they do here — because the ranking behind them is data, not habit. Slab leaks under concrete foundations leads the metro's problem table and freeze-burst pipes in cold snaps follows, so the services answering them lead the list. The long tail of a metro's plumbing life — fixture failures, toilet calls, the single unexplained leak — fills in the diary around them, here as everywhere.
Ranked for this metro alone, from its Census housing profile and NOAA climate record.
The slab leak's cruellest feature is its patience. A pinhole in a pressurised line under concrete does not rest: it runs at night, on holidays, while the house stands empty, moving water into soil that carries it away unseen. Weeks of that patience show up in the aggregates — a bill trending up across three statements, a meter reading that will not reconcile with the household's habits. In Jacksonville's slab-built districts the pattern repeats in house after house of the same subdivisions, because the lines were poured in the same seasons and age in convoy. Detection ends the patience at a marked point on the floor.
The cruel arithmetic of a slab leak is that time is water. A pinhole under concrete does not drip into a bucket; it saturates the ground, swells what can swell, and bills the household for every gallon. Weeks of it can pass between the first warm patch on the floor and the diagnosis, which is why the meter test matters so much in Jacksonville's slab districts: ten minutes with every tap closed tells a household whether its concrete is hiding something, long before the floor itself confesses.
One more way to size it: this metro holds 85,917 housing units, and slab construction accounts for a large share of everything built from the post-war decades onward — the tracts first, then the 39,350 homes since 2000. A leak class that hides inside that much concrete, in soil that moves with the seasons, does not need unusual bad luck to lead a ranking; it needs only ordinary time.
Ice does its damage in silence and announces it in flood. The split forms under pressure while the line is frozen, holds while the ice plug seals it, and opens the moment the thaw restores flow — which is why burst pipes are so often discovered by sound: water running somewhere it should not be, in a house that was intact at breakfast. Jacksonville's exposure sits where its housing does — in the older districts' unprotected runs and every era's additions and garages — and the repair visit's second job, after the pipe itself, is the insulation and routing that keep the same night from repeating.
Prevention, for this pattern, is a geography lesson: the burst never happens in the middle of the heated house. It happens at the perimeter — the wall cavity on the windward side, the run beneath the addition, the pipe the builder routed through the garage to spare six feet of copper. In Jacksonville, where 43.8 summer days tempt everyone to forget what 42.7 freezing nights intend, the autumn ritual is short and specific: find every line that leaves the warmth, and do something about it. The households that keep that ritual read about burst pipes the way other people do — as news.
Local exposure, stated plainly: a large stock of homes plumbed before freeze protection was designed-in, standing in a climate that freezes on 42.7 nights a year. Either figure alone is unremarkable; together they describe a metro where burst lines are a seasonal category of call, not an anomaly.
Sediment is the water heater's biography, written a layer at a time. Every gallon the tank heats leaves its minerals behind a fraction more completely, and the accumulating bed insulates the water from the burner, forcing longer firings that stress the steel and cook the sediment harder. Jacksonville's heaters write that biography at the pace its climate sets — hard cycling in the hot months, cold inlets in the cold ones. A yearly drain-down edits the biography while the tank is young; left unread for a decade, it ends the way most such stories end, with a replacement chosen under time pressure.
Recovery time is the number that runs a household's mornings, and it is the first thing sediment steals. A tank rated to serve a family when new delivers less hot water per heating cycle every year as the sediment layer thickens and the burner's work goes into heating rock instead of water. In Jacksonville, where summer demand piles showers, laundry and dishwashing into the same hours, that slow decline shows up as a household quietly rationing hot water without ever deciding to. Flushing the tank returns some of it; a spent anode and a rumbling, scaled tank are the signs the decline has become structural, and the conversation turns to replacement.
Scale the workload: 72,516 households, each cycling a tank through chores, showers and laundry, under a climate that loads the system at both temperature extremes across the year. Tank failures distribute across that base like weather — individually unpredictable, collectively as regular as the seasons that drive them.
When a storm system pushes through Jacksonville, the plumbing load arrives as water: saturated ground pressing on laterals, storm runoff testing every joint, and households running everything at once once the weather clears. The homes that ride the season out well are the ones whose drains were clear before it started — a line at half capacity in June is a backup in September.
When the storms come, Jacksonville's plumbing meets them in the ground: laterals under saturated soil, cleanouts under standing water, ground floors at the level the water is looking for. The season tests the buried half of every system here, and it tests the older districts — where the lines are jointed clay and iron — hardest of all. Preparation is unglamorous and specific: know the cleanout, know the shutoff, know the ground-floor drain in the house.
What makes the slab leak the defining pattern of the growth-era metro is the combination of concealment and consequence. Concealment, because the line is entombed: no crawl space to inspect, no basement ceiling to stain. Consequence, because the escaping water undermines the very ground the slab rests on and feeds the heater a second, phantom household to supply. Jacksonville's slab stock spans both the post-war tracts and the 39,350 homes built since 2000 — the pattern crosses eras wherever the concrete does — and its detection has become a small science of meters, microphones and thermal cameras precisely because eyes are useless here.
Read the ranking backwards and it reads as a data summary: 208,537 residents in 85,917 housing units, 8.3% of the housing from before 1960, 56.51 inches of rain in an average year. The pattern leads because the exposure is broad — counted not in individual unlucky houses but in whole eras of the metro's building, stacked one on another.
Experienced local practice starts with the simple certainties — the observations that take minutes and decide the most:
 PROBLEM
 SOLUTION
Population 73,507
Population 14,205
Population 7,780
Population 4,532
Population 4,160
Population 2,556
Population 2,387
Population 1,753
Population 982
Population 699
The communities in the grid are not suburbs of the page; they are its subject as much as Jacksonville is. Piney Green (14,205 residents) and Half Moon (7,780) carry their own building decades, their own pipe materials and their own positions in the problem ranking's logic — a lateral under a Piney Green street answers to the same data as one in the centre, but to a different era of it. Coverage here is defined by the ZIP list below; understanding is defined street by street, and this page's figures are the metro-wide version of a story each community tells in its own numbers.
Also on the Jacksonville map: Holly Ridge (4,532), Surf City (4,160), Sneads Ferry (2,556), Richlands (2,387), Pumpkin Center (1,753) — communities spread across Onslow, each with housing from its own growth years. A plumber routed through PlumbReach USA to any of them is working from this same page: the metro data does not change at the city limit, but the housing on your street — its age, its materials, its soil — is what the visit is really about.
Jacksonville (73,507 residents) anchors the metro, and Piney Green (14,205) is its second centre of gravity. Between them they hold the bulk of the 72,516 households — and, not coincidentally, the bulk of every housing era this page discusses, from the pre-1960 core to the newest subdivisions. Half Moon (7,780) and the communities beyond it repeat the same eras at smaller scale.
The metro answers to 1 county governments (Onslow), a patchwork that matters at permit time rather than at the pipe. Onslow County carries the centre; the others carry the growth rings and the older outlying towns. A plumber routed through this page works inside that patchwork daily — the water does not care about the boundaries, but the job's paperwork does.
This page ends at the metro boundary, but the region does not: Wilmington, NC, Greenville, NC and Rocky Mount, NC continue the coverage in their own directions, each with a profile built from its own Census and NOAA figures. If your home sits near the line between metros, go by your ZIP code — it places you in the dataset that describes your housing.
Set Jacksonville among its neighbours and the contrasts sharpen the profile: Wilmington, NC — metro population 492,772, median build year 1996 — sits 46 miles away; Greenville, NC (182,936, median 1993) 58 miles; Rocky Mount, NC (148,486, median 1983) 83 miles. Three different housing stocks under three nearby skies, which is why each keeps its own page and its own problem ranking rather than borrowing this one.
Ratios tell the metro's story compactly. Renters occupy 39.0% of homes; owners hold the rest. For every home built since 2000 there are 0.6 from before 1980. Spread the stock across the coverage map and each ZIP code carries about 6,609 housing units — the density at which era patterns repeat street after street instead of scattering, and at which a routed round of calls stays inside a few districts.
Jacksonville by the derived numbers — median home age 29 years · owners in 44,235 homes, renters in 28,281 · each covered ZIP code carrying about 549 pre-1960 homes · a heating-to-cooling degree-day ratio of 1.23 · 1,435 mm average annual rainfall.
Before an emergency, read the guide: How to shut off your home's water main
Describe the problem and the call center routes you to an independent local plumber who works in the Jacksonville metro.
Call center hours: Mon-Fri 7:00 AM-10:00 PM ET | Sat 8:00 AM-10:00 PM ET | Sun 7:00 AM-9:00 PM ET