

Home / Cities / Arkansas / Fort Smith

Plumbing Services in Fort Smith, AR

Everything on this page was computed for Fort Smith and nowhere else: the problem ranking from its Census housing profile, the seasonal risks from its NOAA station record, the coverage from its own ZIP codes. PlumbReach USA connects you to an independent local plumber; the page itself is the homework, done in public, so the call you make is an informed one.

Call center hours: Mon-Fri 7:00 AM-10:00 PM ET | Sat 8:00 AM-10:00 PM ET | Sun 7:00 AM-9:00 PM ET

31
ZIP codes covered
3
Counties in the metro
90,129
Households (Census ACS)
1983
Median year home built
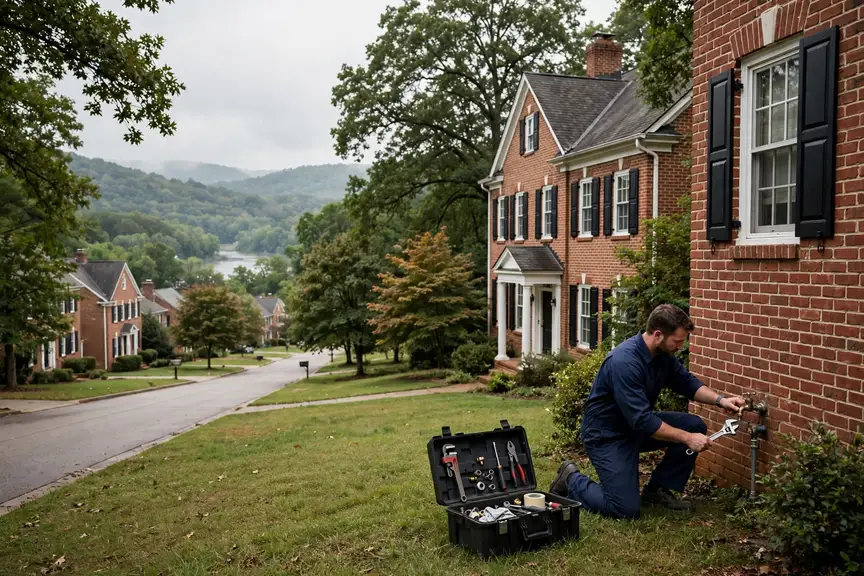
Fort Smith, AR — the metro skyline and landscape
Fort Smith, AR — plumbing help across the metro
A local plumber's van on a residential street
A service van between calls in Fort Smith
Water heater installation in a home garage
Heater calls follow the housing eras in Fort Smith

Fort Smith plumbing, in brief

The median Fort Smith home was built in 1983; 45.0% of the stock predates 1980, and the pattern this metro's own data ranks first is freeze-burst pipes in cold snaps. PlumbReach USA is a referral service, not a plumbing company: one call connects you with an independent local plumber serving your ZIP code.

The Fort Smith housing stock, and what it means for plumbing

Read Fort Smith through its counties and the picture sharpens. Crawford, Sebastian, Sequoyah were not built in the same decades or for the same households, and their plumbing carries those differences: an older core where 17.3% of the metro's homes predate 1960, growth corridors where the subdivisions arrived in waves, and edges still being built out. The metro-wide medians — a middle home built in 1983, 100,960 housing units in all — are the average of those local stories, and the sections below are organised by the patterns the combined record produces, from the oldest pipe materials to the newest failure modes.

There is a materials timeline buried in Fort Smith's housing figures, and it reads like a plumber's diary. The 17,466 homes from before 1960 were drained in cast iron or clay and supplied, in many cases, in galvanized steel. The 27,966 that followed between 1960 and 1979 mixed those materials with early copper. Then came the 31,197 homes of 1980-1999, plumbed increasingly in copper and early plastics. Each band of that timeline is now a band of characteristic failures, arriving in the order the materials tire — which is why a home's build year, in this metro, is the single most predictive fact about its plumbing.

Growth wrote this metro's newest plumbing chapter in plastic and concrete: supply and drain lines in modern materials, fixtures by the catalogue, foundations poured as slabs across the subdivisions near Van Buren and Greenwood. The chapter is young — its systems have decades in hand — but it is not exempt from the metro's arithmetic: 2,177 cooling degree days of demand work its heaters hard, and the soil under its slabs moves with the same seasons as the soil under the oldest farmhouse in Crawford County.

The climate written over all of it comes from the NOAA station at FT SMITH RGNL AP, AR US: an average year brings 3,098 heating degree days, 2,177 cooling degree days and 47.34 inches of precipitation. Those are not abstractions to a buried pipe or an exposed line — they set how often soil around a sewer lateral swells and shrinks, how hard a water heater cycles in January and July alike, and whether an uninsulated garage line is a worry or a certainty. The problem sections that follow are selected by exactly these numbers, combined with the housing-age profile above.

The Fort Smith plumbing profile in numbers

The metro's building eras on one side, its weather record on the other — and its plumbing where the two meet.

Break the stock down by building era and the profile sharpens. Before 1960: 17.3% of homes, roughly 17,466 of them. From 1960 to 1979: 27.7%, about 27,966. From 1980 to 1999: 30.9%, about 31,197. Since 2000: 24.1%, about 24,331. Four eras, four material palettes — and the balance among them is this metro's plumbing character in a single paragraph.

The metro's plumbing present was installed between 1980 and 1999, and it is ageing as a cohort. That cohort's traits are consistent: sound bones, wearing surfaces. The systems beneath these homes are not failing from corrosion sagas but from the accumulated cycles of two to four decades — and the work they generate is the steady, schedulable kind, provided it is scheduled. Left alone, cohort ageing has a way of arriving all at once; attended to, it is the most manageable profile a metro can have.

The second band in the table is the 1960-1979 stock: 27,966 homes, 27.7% of the metro. It is the transition generation — copper arriving, galvanized lingering, drains mixed street by street — and it supplies Fort Smith with its most diagnostic plumbing: two homes of the same year needing opposite answers, decided by what the builder happened to specify.

The climate column of this profile is a workload statement. 3,098 heating degree days say how long the cold half of the year keeps inlet water near its chilliest and heaters firing at their hardest; 2,177 cooling degree days say how relentlessly the hot half loads every drain and tank; 62.6 freezing nights and 77.7 hot days mark the extremes where the failures concentrate. NOAA keeps these figures at FT SMITH RGNL AP, AR US as thirty-year normals — which is to say, as the closest thing plumbing has to a settled forecast.

A profile is only useful if it predicts something, and this one predicts the shape of a plumbing diary in Fort Smith: which streets will call about drains, which about pressure, which about heaters, and in which months. Everything after this section is that prediction written out as services, problems and answers — the numbers first, the narrative second, the way the evidence actually runs.

Plumbing problems Fort Smith homes actually get

Ranked for this metro alone, from its Census housing profile and NOAA climate record.

Freeze-burst pipes in cold snaps

There is a particular silence after a hard freeze in Fort Smith: the pause while households open taps one by one, auditing the night. Most winters, most homes pass. The failures cluster where they always cluster — the addition plumbed in a hurry across a crawl space, the garage wall line, the hose bibb nobody drained — because cold air is a systematic inspector and it works from a list. The record at FT SMITH RGNL AP, AR US guarantees the inspection recurs: this is not a freak-weather problem but a standing appointment between the climate and the metro's least-protected pipework, kept every year whether the household remembers it or not.

The burst itself usually happens quietly, inside a wall or under a floor, during the coldest hours — but the flood waits for the thaw. Ice seals the split it made, and only when temperatures rise and the ice lets go does the water start moving into the house. That delay is why freeze damage so often greets a Fort Smith household in the morning or on return from a trip away. It is also why the checks after a hard freeze matter: pressure oddly low, a meter turning with nothing running, a damp patch at a wall base. Catch the split at the weep stage and the repair is a pipe; catch it after the thaw and it is a room.

Look at the shape of the risk in Fort Smith: 62.6 sub-freezing nights a year at FT SMITH RGNL AP, AR US means the exposure is a season, not an event. Stack that against the housing side — 45,432 homes built before modern freeze protection was routine — and the pattern explains itself: many lines, many cold nights, and a failure that needs only one bad intersection of the two.

Watch for

  • A tap that runs slower or stops during a cold snap, then returns
  • Frost or condensation on an exposed pipe in the garage or crawl space
  • A sudden drop in pressure, or the sound of water, as temperatures rise after a freeze

About pipe repair & repiping ➔

Galvanized pipes at the end of their life

Galvanized steel announces its age through the water itself. The zinc coating that once protected the pipe is long spent; the steel beneath rusts inward, and the bore narrows to a passage that delivers less water every year. Households adapt without noticing — the shower accepted as weak, the washing machine's fill taken as slow — until a fixture upgrade or a guest's comparison names the decline. In Fort Smith's pre-1980 districts that decline is the stock's shared condition, written into 45,432 homes, and the repipe conversation begins when the household stops adapting and starts measuring.

Galvanized pipe fails politely, which is exactly the problem — it gives a household years of small warnings that are easy to live with. The zinc coating that once protected the steel wears through, rust takes its place, and the rust grows inward like a narrowing artery. Flow to the farthest fixtures drops first. A shower that shares a line with a running tap loses its pressure. By the time the water itself runs discoloured after the house has sat quiet overnight, the narrowing is well advanced. None of this is a single emergency; it is a system reaching the end of its design life on schedule, and in Fort Smith's pre-1980 neighbourhoods that schedule is arriving for whole streets at once, because the pipes went in together.

Count the exposure from the Census side: the metro's 45,432 pre-1980 homes were plumbed in galvanized's long reign, and the material's failure mode — internal rust, narrowing bore — is a matter of chemistry, not workmanship. The variable is speed; the direction, for every one of those systems still original, is settled.

Watch for

  • Fixtures farthest from the meter noticeably weaker than near ones
  • Rust-coloured first water of the day that clears within seconds
  • Shower pressure that drops hard when a second tap opens

About pipe repair & repiping ➔

Ageing sewer laterals

Between the house and the street connection sits the lateral — the home's own stretch of sewer line — and it is the homeowner's responsibility, which surprises many people the first time it fails. In Fort Smith, where 17.3% of homes were built before 1960 and the median home dates to 1983, laterals have been in the ground through decades of soil movement, root growth and material ageing. Clay joints shift and open, older pipe bellies where bedding has washed out, and a line can lose its clean fall to the street, so waste slows, settles and eventually blocks. The signs are house-wide rather than fixture-specific: several drains slow together, the ground-floor fixtures act up first, and cleanings help for shorter and shorter stretches. A camera run down the lateral settles the argument about what is happening — it measures the damage by distance, shows whether it is one bad joint or the whole story of the line, and lets the repair be sized to the actual problem instead of the whole run by default.

A lateral gives decades of silence and then a short conversation. The conversation usually starts with the ground-floor drain in the house and escalates through the cleanout to the camera — and the camera's footage settles every argument about whether the line is blocked or broken. Across Fort Smith, the laterals entering that conversation now are the ones buried when the metro's median home went up, in 1983. They were built to outlast their mortgages, and they have; the question the footage answers is how much further the same pipe can honestly be asked to go.

The depth of the bench matters locally: this is not a pattern confined to a few old streets. Every district built before modern plastic — the core, the post-war rings, the middle suburbs — holds laterals of the same generations, and the metro's own growth means their combined length runs to thousands of miles of buried, jointed, ageing pipe. The ranking reflects that inventory, nothing more exotic.

Watch for

  • Several drains slow at the same time
  • Ground-floor fixtures in the home back up first
  • Cleanings that help for less time each visit

About sewer line repair & replacement ➔

Winter pipe season in Fort Smith

Living with a real winter, as Fort Smith does, means the season has a rhythm: the first hard freeze finds the unprepared lines, mid-winter tests the insulation, and the late thaws reveal whatever split quietly weeks before. Households that drain exterior lines in autumn and keep a trickle running on the coldest nights get through most winters with nothing to report.

The numbers behind the season here: 62.6 nights a year at or below freezing at FT SMITH RGNL AP, AR US, against a housing stock whose median build year is 1983. Every winter writes the same exam for Fort Smith's older pipes, and every winter some of them — usually in the the 1980s districts first — fail it.

A closer look: freeze-burst pipes in cold snaps in Fort Smith

Freeze damage in Fort Smith is not evenly distributed, and the climate record explains the map. The splits happen where cold air and water lines meet: exterior walls, crawl spaces, garages, additions — features of the older housing in the districts around Fort Smith and the pre-war pockets, plumbed before routing lines through heated space was standard. The record at FT SMITH RGNL AP, AR US — 62.6 freezing nights in an average year — says the examination is annual. A home passes it by where its lines run, not by how new they are, which is why a 1950s house with interior lines can outscore a newer build with a garage run.

The numbers underneath it, for Fort Smith: 100,960 housing units, a median build year of 1983, and a climate record at FT SMITH RGNL AP, AR US of 3,098 heating degree days against 2,177 cooling degree days. Cross the housing record with the weather record and this pattern is what falls out at the top — rarely the most dramatic problem in plumbing, but the one this metro's stock and climate manufacture most steadily.

Experienced local practice starts with the simple certainties — the observations that take minutes and decide the most:

  • Every line routed through unheated space, listed before winter rather than after
  • Outside taps: hoses off, lines drained, covers on
  • Cabinet doors and insulation on outside-wall runs, the cheapest protection there is
  • The household's plan for a hard freeze: who shuts the water off, and where the key is

Plumbing services in Fort Smith

Ordered by what this metro's data says its homes need most.

Pipe Repair & Repiping in Fort Smith

Pipes fail in two tenses: suddenly, at a joint or a split, and gradually, as a material narrows, thins or pits across a whole system. The first tense asks for a repair; the second eventually asks the larger question. Pipe services cover both — the sectional fix that restores a sound system, and the planned renewal that replaces a failing material through the whole house, routed to spare the building and staged to keep the household in water.

Walk the older streets of Fort Smith with a plumber and you will hear the housing stock dated by its pipework: galvanized behind this wall, copper of a certain vintage there, a repipe already done on the corner house. The metro's median build year of 1983 means that dating game works on half the homes in the metro. What decides any individual home's path is not the street's average but the evidence inside its own walls — pressure at the fixtures, the water's colour after a quiet weekend, the count of repairs already made. The assessment is short; the conclusion follows from it. In Fort Smith that holds across 31 ZIP codes, from Fort Smith out to Greenwood.

Pipe work divides by era in this metro with unusual neatness: renewal conversations in the 45,432 pre-1980 homes, sectional repairs in the middle ring, and near-silence from the 24,331 post-2000 homes whose lines are still young. A call from Van Buren can sit in any of the three bands; the home's build year says which before the door opens.

More about pipe repair & repiping ➔

Sewer Line Repair & Replacement in Fort Smith

Between the house and the street lies the lateral — privately owned, commonly forgotten, and the source of the worst backups a home can have. Sewer work begins with a camera survey of that run: its material, its fall, its invaders. Spot repairs suit local damage; a line failing along its length gets replaced, not patched into a subscription.

The sewer lines under Fort Smith are as old as its oldest streets. 17.3% of homes here were built before 1960, when clay and cast iron were the standard materials, and those lines have now carried sixty-plus years of service under soil, roots and traffic. The failures cluster where the trees are mature and the pipe is jointed — the established neighbourhoods around Fort Smith and the historic core — because roots have had the most years to find the joints. A camera run tells the truth about any given line: how much is scale and roots that cleaning can handle, and how much is a pipe at the end of its story. That is the daily reality for the 90,129 households spread across Crawford, Sebastian, Sequoyah.

Sewer demand follows the founding map: the districts built first, around the old centre and out through Sallisaw, hold the jointed clay and iron; the growth rings hold plastic with decades in hand. 17.3% of the metro's homes stand on the founding side of that line, which is why the footage here so often shows a pipe at the end of its story.

More about sewer line repair & replacement ➔

Water Heater Repair & Installation in Fort Smith

From Fort Smith to Sallisaw, the heater question is the same — repair the unit or renew it — and the honest answer starts from its age against Fort Smith's demand record, which this page sets out.

More about water heater repair & installation ➔

Emergency Plumbing in Fort Smith

One call from anywhere in the Fort Smith metro — from Fort Smith out to Sallisaw — routes to the local professional on cover; the failure patterns they expect first are the ones this page's data ranks.

More about emergency plumbing ➔

Drain Cleaning in Fort Smith

Across Crawford, Sebastian, Sequoyah, drain calls follow the building map: iron and clay near the old core around Fort Smith, plastic at the growth edge — one service, two different crafts, both covered by the routing on this page.

More about drain cleaning ➔

Leak Detection & Repair in Fort Smith

Leak detection in Fort Smith is instrument work over local knowledge: acoustic and thermal tools, aimed first at the districts this page's data flags — the pre-1980 stock and the slab tracts out toward Greenwood.

More about leak detection & repair ➔

Toilet Repair & Installation in Fort Smith

Toilet calls in Fort Smith are the small end of the diary and the most democratic: every era of the 100,960-home stock produces them, and the local fix starts with the mechanism in the tank, not the porcelain.

More about toilet repair & installation ➔

Faucet, Fixture & Garbage Disposal Repair in Fort Smith

Drips and disposals across Crawford, Sebastian, Sequoyah are small jobs with a standard: repair the mechanism where the fixture deserves it, renew it where it does not, and check the shutoffs and supply lines while the cabinet is open.

More about faucet, fixture & garbage disposal repair ➔

What Fort Smith books most

There is a plainer way to say what this page's ranking means in practice: most calls in Fort Smith are two calls. The first answers Freeze-burst pipes in cold snaps; the second answers galvanized pipes at the end of their life. Between them they account for the shape of a local plumber's week here — the districts visited, the parts stocked, the diagnoses made fastest because they are made most often. The remaining services divide the rest of the diary among them, essential but episodic, the supporting work around two leading patterns.

From problem to fixed, in Fort Smith

A plumbing problem inside a Fort Smith homePROBLEM
➔
The same system in Fort Smith after professional repairSOLUTION

Areas covered in the Fort Smith metro

Fort Smith

Population 89,496

Van Buren

Population 23,545

Greenwood

Population 9,570

Sallisaw

Population 8,553

Alma

Population 5,879

Barling

Population 4,919

Roland

Population 3,527

Muldrow

Population 3,292

Lavaca

Population 2,466

Arkoma

Population 2,001

Cedarville

Population 1,750

Mulberry

Population 1,573

Also in the Fort Smith metro: Mansfield (population 1,341), Vian (population 1,322).

The communities in the grid are not suburbs of the page; they are its subject as much as Fort Smith is. Van Buren (23,545 residents) and Greenwood (9,570) carry their own building decades, their own pipe materials and their own positions in the problem ranking's logic — a lateral under a Van Buren street answers to the same data as one in the centre, but to a different era of it. Coverage here is defined by the ZIP list below; understanding is defined street by street, and this page's figures are the metro-wide version of a story each community tells in its own numbers.

Beyond the largest communities sit Sallisaw (8,553), Alma (5,879), Barling (4,919), Roland (3,527), Muldrow (3,292) — smaller places across Crawford, Sebastian, Sequoyah, covered on the same terms. Their housing tends to be older on average than the big suburbs', and their calls follow the older patterns on this page. One routing covers them all: find your ZIP code below and the rest is a phone call.

Fort Smith ZIP codes we cover

72901, 72903, 72904, 72905, 72908, 72916, 72921, 72923, 72932, 72934, 72935, 72936, 72937, 72938, 72940, 72941, 72944, 72945, 72946, 72948, 72952, 72955, 72956, 74435, 74936, 74945, 74946, 74948, 74954, 74955, 74962

The Fort Smith metro in detail

Fort Smith (89,496 residents) anchors the metro, and Van Buren (23,545) is its second centre of gravity. Between them they hold the bulk of the 90,129 households — and, not coincidentally, the bulk of every housing era this page discusses, from the pre-1960 core to the newest subdivisions. Greenwood (9,570) and the communities beyond it repeat the same eras at smaller scale.

Administratively the metro is drawn from Crawford, Sebastian, Sequoyah — 3 in all — with Crawford County at its centre. County lines do not change pipe physics, but they do shape the paperwork around the work: permits, inspections and code details are county and city business, which is one reason the professional who serves your street is a local one.

This page ends at the metro boundary, but the region does not: Fayetteville–Springdale–Rogers, AR, Little Rock, AR and Tulsa, OK continue the coverage in their own directions, each with a profile built from its own Census and NOAA figures. If your home sits near the line between metros, go by your ZIP code — it places you in the dataset that describes your housing.

The region around Fort Smith is a set of variations on its theme: Fayetteville–Springdale–Rogers, AR, 51 miles off, runs a median build year of 1997 on a metro population of 622,177; Little Rock, AR (122 miles) medians 1988 on 777,607; Tulsa, OK (105 miles) medians 1981 on 1,069,273. Nearness is not sameness — a few decades of median build year separate their plumbing as surely as the miles separate their maps.

Divide the stock by the map and the densities appear: roughly 3,257 housing units for every covered ZIP code, 30,043 households to a county, 14 named communities in the grid. The balance between the generations reads 1.9 pre-1980 homes for every home built since 2000 — a single ratio that quietly predicts whether a metro's plumbing week leans toward renewal work in the old districts or first-generation upkeep in the new ones.

Fort Smith by the derived numbers — median home age 43 years · owners in 59,665 homes, renters in 30,464 · each covered ZIP code carrying about 563 pre-1960 homes · a heating-to-cooling degree-day ratio of 1.42 · 1,202 mm average annual rainfall.

Fort Smith plumbing questions

Is my Fort Smith neighbourhood inside PlumbReach USA's coverage?
The whole Fort Smith metro: 31 ZIP codes across Crawford, Sebastian, Sequoyah, from Fort Smith through Van Buren and Greenwood and every community in the grid on this page. If your ZIP code appears in the coverage list, a local plumber serving your street can be routed to you through one call. One measure of the footprint: Fort Smith accounts for 39.1% of the metro's people, and the remaining share spreads across the communities in the grid — every one of them plumbed in its own decade, every one of them a single call from a local professional. The boundary is worth stating in numbers: 90,129 households, a median build year of 1983, and a climate record kept at FT SMITH RGNL AP, AR US — the coverage and the data describe the same ground. Read the boundary in its own numbers: the list opens at 72901 by Fort Smith (89,496 residents), crosses 72935 near Van Buren (23,545) and 72952 near Greenwood (9,570), and closes at 74962 — 31 codes over Crawford, Sebastian, Sequoyah in all. Stated as the stock it covers: the era ledger reads 17,466 homes before 1960, 27,966 from 1960-1979, 31,197 from 1980-1999 and 24,331 since 2000 — 100,960 units, 90,129 households, 66.2% of them owner-occupied.
My Fort Smith home was built around 1983. What plumbing should I be watching?
Age shows in a predictable order here. Supply lines and shutoff valves from the the 1980s tire first, then drain joints, then the fixtures themselves. Fort Smith's figures explain the queue: a median build year of 1983 means half the metro's homes are older than yours or the same age, all ageing on the same schedule. The pattern matters more than any single fault — sequential leaks in the same material are the classic signal. In Fort Smith that plays out across 31 ZIP codes, from Fort Smith to Van Buren. The same watch-list runs metro-wide: from Van Buren (23,545 residents) to Greenwood (9,570) and Sallisaw, across Crawford, Sebastian, Sequoyah, the 45,432 pre-1980 homes share the materials this answer describes — which is why a neighbour's leak two streets away is worth a homeowner's attention here. Scale explains the pattern: 100,960 housing units share this stock profile, and the 27,966 homes of 1960-1979 alone outnumber the entire housing stock of most smaller metros. The counts behind the watch-list: 17,466 homes before 1960, 27,966 between 1960 and 1979, 31,197 between 1980 and 1999, 24,331 since 2000 — 100,960 units in all. And the climate pressing on every era alike: 62.4 degrees on average at FT SMITH RGNL AP, AR US, 77.7 hot days, 62.6 freezing nights, 47.34 inches of rain.
What is the most common plumbing problem in Fort Smith?
It is the pattern this page puts first: freeze-burst pipes in cold snaps. There is a particular silence after a hard freeze in Fort Smith: the pause while households open taps one by one, auditing the night. Prevention talk usually starts there as well, because the largest single source of callouts is the one where a watched home can actually change the ending — catching the early signs costs a house call, while catching the late ones costs a floor. The backdrop is the same metro-wide: 100,960 housing units working against the FT SMITH RGNL AP, AR US climate record. The ranking's local weight: Freeze-burst pipes in cold snaps sits on top because the stock manufactures it — 45,432 pre-1980 homes, 77.7 hot days and 62.6 freezing nights a year at FT SMITH RGNL AP, AR US, all pressing the same systems. The full scoring line for Fort Smith: Freeze-burst pipes in cold snaps first, galvanized pipes at the end of their life second, then the rest — computed over 100,960 housing units, 77.7 hot days, 62.6 freezing nights and 47.34 inches of rain. The inputs behind the ranking, code by code: the codes run 72901, 72935, 72952, 74962 and 74435 among the 31 on the list, spread over Crawford, Sebastian, Sequoyah.
Does Fort Smith's weather affect my plumbing?
Directly. The long-term normals at FT SMITH RGNL AP, AR US — 3,098 heating degree days, 2,177 cooling degree days, 47.34 inches of precipitation in an average year — set the local plumbing calendar: freeze risk for exposed lines in the cold stretch, heavy heater and drain loads through the hot months, and soil that swells and shrinks between seasons, which buried lines feel before anything else does. The figures behind that answer, from the station record: a yearly average of 62.4 degrees, 47.34 inches of precipitation, 77.7 days at 90 or above and 62.6 nights at freezing or below — the four numbers this page's seasonal section is built from. It is the same story from Van Buren to Greenwood — the stock decides, and this stock's median build year is 1983. That is the metro-wide version; the household version differs by exposure — a shaded lot in Van Buren, an open slab in Greenwood (9,570 residents), a crawl space in Sallisaw — but the loads themselves, 3,098 heating degree days against 2,177 cooling, are the same sky over every roof in Fort Smith. Compare the load across the footprint and it does not change: the same 3,098 heating degree days fall on Van Buren (23,545 residents) as on the core, the same 2,177 cooling degree days on Sallisaw — one sky, every roof. Filed with the record: FT SMITH RGNL AP, AR US also logs the extremes the averages hide — and the stock it falls on runs to 45,432 pre-1980 homes out of 100,960 units, spread from Fort Smith to Sallisaw. The ground it falls on, in codes: the codes run 72901, 72935, 72952, 74962 and 74435 among the 31 on the list, spread over Crawford, Sebastian, Sequoyah.
A line has let go somewhere in my Fort Smith house and water is spreading. What happens first?
Do not hunt for the leak; hunt for the valve. While water is moving, its source matters less than its supply. The shutoff for most Fort Smith homes is at the meter by the street or where the main line enters the building — close it and the emergency becomes a mess instead of a disaster. Then drain the system from its bottom tap, keep feet and hands away from any socket or appliance the water has reached, and call with the damage already stopped. Across the metro's 3 counties, Crawford County included, the pattern repeats wherever the housing matches. The local detail that decides how the first minutes go: which side of Fort Smith the home sits on. Houses in Van Buren and the older districts tend to shut off at an interior valve; slab homes out toward Greenwood and Sallisaw more often at the meter — worth knowing before the water is moving, across all 31 covered ZIP codes. After the water is off, the metro's pattern helps the call: telling the professional your district — near Van Buren, out toward Sallisaw — tells them which housing era's shutoff and stock they are walking into. One fact steadies the first minutes: your home is one of 100,960 in a metro whose median build year is 1983 — the valve arrangement follows that era, indoors in the older stock, out at the meter in the slab rings. True across the whole stock: the era ledger reads 17,466 homes before 1960, 27,966 from 1960-1979, 31,197 from 1980-1999 and 24,331 since 2000 — 100,960 units, 90,129 households, 66.2% of them owner-occupied — the valve's address changes with the era, the first move does not. And if the call goes out, the geography that frames it: Fort Smith sits 51 miles from Fayetteville–Springdale–Rogers, AR, 122 miles from Little Rock, AR and 105 miles from Tulsa, OK — three neighbouring metros, three different housing stocks, none of them the stock inside your walls. Learn it street by street if you must: the 74962 subdivisions shut off at the meter, the 74435 districts at the wall, the oldest homes out toward 72904 at a curb stop — the map of valves is the map of build decades.
My Fort Smith home keeps springing leaks. Is repiping the real answer?
Sometimes, and the distinction is mechanical. Repairs replace a section; repiping replaces a material — and it is the material, not the section, that is failing when leaks multiply in an older Fort Smith home. Galvanized lines from the metro's pre-1980 stock (45.0% of all homes) are the usual defendant. A plumber who recommends a fourth repair on that pattern without naming the alternative is not doing you a favour. Homeowners in Van Buren (23,545) and Greenwood (9,570) read this page for the same reason — the stock there is the same stock. It holds in the 31,197 homes built between 1980 and 1999 just as it holds in the older core. The pattern is not evenly spread: it concentrates in the 45,432 pre-1980 homes, thickest in the founding districts and the first suburbs — the streets around Van Buren and the old core — and thins toward Sallisaw and the growth edge, where the stock is a generation younger. Put the metro's numbers to it: 45.0% of homes predate 1980, so the repipe conversation is a standing item here in a way it is not in younger metros — Fort Smith simply has more of the defendant material in the ground and in the walls. Against the whole stock — 100,960 housing units, 90,129 households, 45.0% of them pre-1980 — the sequence test is how Fort Smith plumbers separate a repair from a renewal without guessing. The defendant material's full extent: the era ledger reads 17,466 homes before 1960, 27,966 from 1960-1979, 31,197 from 1980-1999 and 24,331 since 2000 — 100,960 units, 90,129 households, 66.2% of them owner-occupied.
Is PlumbReach USA the company that will do the work at my Fort Smith home?
An independent local plumber — not a PlumbReach USA employee. We run the connection service and the call center hours listed on this page; the professional who serves Fort Smith runs their own business, sets their own schedule with you, and does the work. We think that arrangement works well when it is stated plainly, so we state it on every page. The local figures behind it: 45,432 homes from before 1980 and 24,331 built since 2000, sharing one system of streets and soil. From Van Buren to Sallisaw, the model does not change: PlumbReach USA publishes the homework — this page, built from Fort Smith's Census and NOAA records — and routes the call; the independent professional who serves that part of Crawford, Sebastian, Sequoyah does everything at the home. The model's footprint on this page is exact: 31 ZIP codes across Crawford, Sebastian, Sequoyah, 90,129 households — in every part of it, the professional who arrives is a local business, and PlumbReach USA's part ends at the connection. Nothing about the arrangement changes with the data on this page: FT SMITH RGNL AP, AR US's record, a median build year of 1983, 45,432 pre-1980 homes — the homework is ours, the work is the local professional's, in every district alike. The arrangement holds across the whole stock: the era ledger reads 17,466 homes before 1960, 27,966 from 1960-1979, 31,197 from 1980-1999 and 24,331 since 2000 — 100,960 units, 90,129 households, 66.2% of them owner-occupied — in each era, the professional is local and independent.
Which small plumbing jobs prevent big ones in a Fort Smith house?
The checks that pay here are the ones matched to the two loads this metro applies: heat and age. Heat: flush the heater before the 77.7-day hot stretch, and keep the ground-floor traps wet through it. Age: exercise every shutoff in a stock where 45,432 homes predate 1980, and read the meter at rest twice a year. Add the cleanout glance after the heaviest rain — 47.34 inches fall in an average year — and the calendar is complete. The local version of the list is set by FT SMITH RGNL AP, AR US's record and the Census profile together: a median home built in 1983, 47.34 inches of rain in an average year, and the patterns ranked at the top of this page. Another metro's calendar would order the same checks differently; Fort Smith's numbers order them this way. The checks travel well because the conditions do: FT SMITH RGNL AP, AR US's record covers Van Buren, Greenwood and Sallisaw alike, and the housing eras repeat across all 31 ZIP codes. A neighbour in another district keeping the same calendar is not copying you; they are reading the same data. What the routine is really insuring against is written at the top of this page: the patterns this metro's 3,098 heating degree days and 77.7 hot days manufacture out of its housing eras, caught while they are still whispers. The calendar's arithmetic: 77.7 hot days and 62.6 freezing nights at FT SMITH RGNL AP, AR US, 47.34 inches of rain, over a stock of 100,960 homes — 45,432 of them pre-1980, 24,331 since 2000. The routine's households, community by community: the community ledger reads Fort Smith (89,496 residents), Van Buren (23,545), Greenwood (9,570), Sallisaw (8,553) and Alma (5,879), out of 228,916 residents metro-wide.
Who decided that these are Fort Smith's main plumbing problems?
The ranking is computed, not copied. Each pattern is scored against this metro's own figures — the housing-age profile from the Census Bureau's American Community Survey (a median build year of 1983 here, 17.3% of homes before 1960) and the climate normals NOAA keeps at FT SMITH RGNL AP, AR US. A pattern rises when the local stock and the local weather both manufacture it. Another metro's page is ranked by that metro's numbers, which is why the lists differ from city to city. The ranking's geography is visible in the coverage grid: the patterns at the top of the list concentrate where the old stock does — the core around Fort Smith, the first suburbs toward Van Buren — while the growth communities past Greenwood (9,570 residents) pull the ranking's lower half upward year by year. The inputs are on the record: the Census profile of Crawford, Sebastian, Sequoyah — 100,960 housing units, median build year 1983 — and the normals at FT SMITH RGNL AP, AR US. Change either input and the order changes; both are this metro's own. Re-run the sort on any other metro's inputs and a different order falls out; on Fort Smith's — 17.3% pre-1960 stock, 45.0% pre-1980, 77.7 hot days, 62.6 freezing nights — this order is the one the arithmetic returns. The scoring's raw material, era by era: the era ledger reads 17,466 homes before 1960, 27,966 from 1960-1979, 31,197 from 1980-1999 and 24,331 since 2000 — 100,960 units, 90,129 households, 66.2% of them owner-occupied. The full local podium the scoring returns: Freeze-burst pipes in cold snaps, galvanized pipes at the end of their life, ageing sewer laterals — then the rest of the patterns weighed for Fort Smith, each scored on this metro's stock and sky alone. The sort ran over the whole list — from 72901 and 72935 through 72952, 74962 and 74435 to 72904 — and returned one order for all of it, because the inputs were the metro's totals, not any single district's.
Which parts of Fort Smith have the oldest plumbing?
The oldest homes cluster where the metro began: the historic core around Fort Smith and the first suburbs out from it, where the 17,466 pre-1960 homes in this metro mostly stand. It matters because era is destiny for plumbing — those streets hold the cast iron, the galvanized steel and the clay laterals this page's problem list is built from. The newer districts around Van Buren hold younger systems with younger problems: fewer material failures, more wear and installation questions. The counts behind the geography: 17,466 pre-1960 homes (17.3% of the metro), concentrated where the map says — the core around Fort Smith and the first suburbs in Crawford County — against 24,331 homes built since 2000 at the metro's edge. Concentrations, for the record: the oldest systems sit inside the 17,466 pre-1960 homes, and those homes cluster — the founding core, the streetcar-era streets, the first suburbs in Crawford County — rather than scattering evenly across the 31 covered ZIP codes. County lines annotate the same map: the old core sits in Crawford County, and the rings cross into the rest of Crawford, Sebastian, Sequoyah as they widen — the pipework's age follows the building, not the boundary. The rings, counted: 17,466 homes in the oldest, 27,966 in the 1960-1979 ring, 31,197 in the 1980-1999 ring, 24,331 since 2000 — 100,960 in all, centred on Fort Smith (89,496 residents). The oldest systems' addresses, in codes: the codes run 72901, 72935, 72952, 74962 and 74435 among the 31 on the list, spread over Crawford, Sebastian, Sequoyah, with the oldest plumbing toward the first codes on the list. The patterns the oldest stock feeds, in this page's order: Freeze-burst pipes in cold snaps, galvanized pipes at the end of their life, ageing sewer laterals — a ranking the founding districts of Fort Smith dominate precisely because their pipework is the metro's earliest.
What does a plumbing check flag most often in Fort Smith homes?
Four things, in this order: that the water can be shut off at the main; that the water heater's safety valve works and its sediment is managed; that the meter sits still with every tap closed; and that the ground-floor drains in the house run clear. Against a housing stock whose median home dates to 1983, that half-hour of checking covers the failures this metro's data says are likeliest. In Fort Smith the walk has local emphases: with 45.0% of homes predating 1980, original-material supply lines earn an extra look, and with FT SMITH RGNL AP, AR US recording 62.6 freezing nights a year, the exposed runs earn one too. The order stays the same; the attention follows the data. District by district, the same half hour: in Crawford County's oldest homes the flags are materials; in the middle ring, around Van Buren (23,545 residents), they are valves and heaters; at the growth edge they are cartridges and first questions about lines under slabs. Across Crawford, Sebastian, Sequoyah the walk reads the same because the stock rhymes: a median of 1983 in the core districts around Fort Smith, younger past Van Buren — the findings age with the streets. Kept with the house papers, a Fort Smith check reads: shutoff turned, heater age noted, meter still at rest, drains clear — dated against a stock where 45.0% of homes predate 1980 and 62.6 nights a year freeze. The walk's stock, counted before the door opens: the era ledger reads 17,466 homes before 1960, 27,966 from 1960-1979, 31,197 from 1980-1999 and 24,331 since 2000 — 100,960 units, 90,129 households, 66.2% of them owner-occupied.

Before an emergency, read the guide: How to shut off your home's water main

Nearby metro areas

One call to a Fort Smith plumber

One call connects you with an independent local plumbing professional serving Fort Smith and the surrounding metro.

Call center hours: Mon-Fri 7:00 AM-10:00 PM ET | Sat 8:00 AM-10:00 PM ET | Sun 7:00 AM-9:00 PM ET

Call Now
