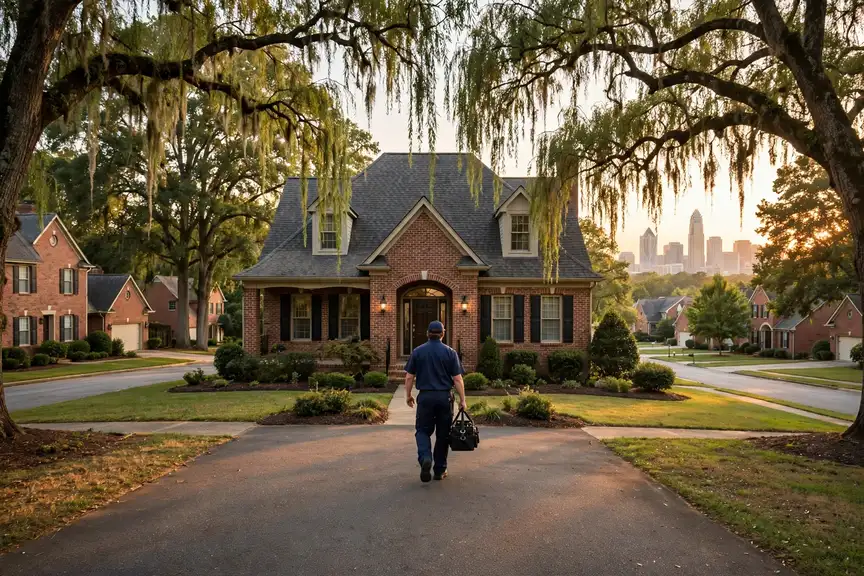


Everything on this page was computed for Charlotte and nowhere else: the problem ranking from its Census housing profile, the seasonal risks from its NOAA station record, the coverage from its own ZIP codes. PlumbReach USA connects you to an independent local plumber; the page itself is the homework, done in public, so the call you make is an informed one.
Call center hours: Mon-Fri 7:00 AM-10:00 PM ET | Sat 8:00 AM-10:00 PM ET | Sun 7:00 AM-9:00 PM ET
The median Charlotte home was built in 1994; 30.0% of the stock predates 1980, and the pattern this metro's own data ranks first is slab leaks under concrete foundations. PlumbReach USA is a referral service, not a plumbing company: one call connects you with an independent local plumber serving your ZIP code.
Every metro is really several, stacked by decade. Charlotte's stack, per the Census, reads: 12.8% of homes from before 1960, a thick middle from the growth decades, and 40.5% from 2000 onward — 1,139,944 housing units in all, wrapped around a median build year of 1994. Plumbing follows the stack faithfully. Each layer went in with its era's materials and workmanship, and each layer is now failing in its era's characteristic order. This page keeps the layering in view throughout, because in a stacked metro the first diagnostic question is never what broke — it is which layer the home belongs to.
Count the older stock by its materials and the metro's maintenance burden comes into focus: iron and clay drains by the tens of thousands of homes, galvanized and early copper supplies in the same walls, fixtures from the first age of mass production still serving in bathrooms across Anson County. None of it failed yesterday; all of it is ageing on schedule together. A homeowner in that stock is not unlucky — they are on time, in a district where the systems were always going to need their generation of attention at once.
The post-2000 homes have a plumbing trait the older districts never had: uniformity at scale. A subdivision's lines went in within a few seasons of each other, so its first heater failures, its first cartridge failures and its first slab questions arrive within a few seasons of each other too. With 461,677 such homes in the metro, those arrivals are not anecdotes but waves, and the households who read them early — who learn their system's age and keep its number handy — meet them as maintenance rather than emergency.
The climate written over all of it comes from the NOAA station at CHARLOTTE DOUGLAS AP, NC US: an average year brings 3,058 heating degree days, 1,769 cooling degree days and 43.6 inches of precipitation. Those are not abstractions to a buried pipe or an exposed line — they set how often soil around a sewer lateral swells and shrinks, how hard a water heater cycles in January and July alike, and whether an uninsulated garage line is a worry or a certainty. The problem sections that follow are selected by exactly these numbers, combined with the housing-age profile above.
The metro's building eras on one side, its weather record on the other — and its plumbing where the two meet.
Break the stock down by building era and the profile sharpens. Before 1960: 12.8% of homes, roughly 145,913 of them. From 1960 to 1979: 17.2%, about 196,070. From 1980 to 1999: 29.5%, about 336,283. Since 2000: 40.5%, about 461,677. Four eras, four material palettes — and the balance among them is this metro's plumbing character in a single paragraph.
Growth is the headline in Charlotte: the post-2000 band is the largest, much of it slab-built subdivisions plumbed in plastic and fitted with cartridge fixtures. The work here is young-stock work — heater replacements arriving in waves as whole streets age together, slab-line questions, fixture internals — carried out on systems whose first owners often never needed a plumber. The metro's older pockets still generate the deep problems, but the volume of its plumbing future is being written in the new subdivisions.
The runner-up era is 1980-1999, with 29.5% of homes. That stock has left its carefree decades and entered its maintenance decades, and it shows in the call pattern around Concord and the other districts of those years: heaters on their second or third cycle, fixtures reaching their wear points together, drains still young enough to reward attention over replacement.
Charlotte's weather, reduced to what a pipe experiences: 49.2 hot days a year loading the drains and heaters, 58.3 freezing nights testing every exposed run, and 43.6 inches of rain moving through the soil that holds the laterals. NOAA's normals at CHARLOTTE DOUGLAS AP, NC US — 3,058 heating degree days, 1,769 cooling degree days — are the long average of that experience, and they are why this metro's problem list is not interchangeable with a milder or harsher metro's.
A profile is only useful if it predicts something, and this one predicts the shape of a plumbing diary in Charlotte: which streets will call about drains, which about pressure, which about heaters, and in which months. Everything after this section is that prediction written out as services, problems and answers — the numbers first, the narrative second, the way the evidence actually runs.
Ranked for this metro alone, from its Census housing profile and NOAA climate record.
A slab leak is quiet in a specific way: no drip to hear, no puddle to see, because the water escapes downward into the ground the house stands on. What surfaces instead are second-order clues — a patch of flooring warm to bare feet, a bill that will not come down, a meter needle moving at 3 a.m. Charlotte's slab neighbourhoods around Charlotte hold thousands of homes plumbed this way, lines entombed in concrete from the day of the pour. Finding the failure is a listening exercise; fixing it is a routing decision; ignoring it is how a pinhole becomes an undermined floor.
The physics under the slab are patient ones. A pressurised copper line resting against aggregate, flexing a fraction with every heating and cooling cycle and every shift of the soil, can wear or corrode at a single point for years before it opens. When it does, the leak is small and constant — which is worse news than a dramatic break, because it can run for months, feeding moisture into the soil the foundation bears on and quietly inflating every water bill. The signs stay indirect precisely because the water never surfaces: it moves down and out, not up. That indirection is why slab leaks are a detection problem first and a repair problem second, and why the listening equipment that locates the leak to a marked square of floor changes the whole shape of the job.
The local denominator matters: 461,677 of the metro's homes went up since 2000, most on slabs, most with lines beneath them. Even a small failure rate across that many buried runs produces a steady stream of leaks — and the stream is young, because those lines are only now reaching the age where soil movement and hot-water cycling start their work.
There is a particular silence after a hard freeze in Charlotte: the pause while households open taps one by one, auditing the night. Most winters, most homes pass. The failures cluster where they always cluster — the addition plumbed in a hurry across a crawl space, the garage wall line, the hose bibb nobody drained — because cold air is a systematic inspector and it works from a list. The record at CHARLOTTE DOUGLAS AP, NC US guarantees the inspection recurs: this is not a freak-weather problem but a standing appointment between the climate and the metro's least-protected pipework, kept every year whether the household remembers it or not.
Prevention, for this pattern, is a geography lesson: the burst never happens in the middle of the heated house. It happens at the perimeter — the wall cavity on the windward side, the run beneath the addition, the pipe the builder routed through the garage to spare six feet of copper. In Charlotte, where 49.2 summer days tempt everyone to forget what 58.3 freezing nights intend, the autumn ritual is short and specific: find every line that leaves the warmth, and do something about it. The households that keep that ritual read about burst pipes the way other people do — as news.
The exposure is written in the climate record: CHARLOTTE DOUGLAS AP, NC US averages 58.3 nights a year at or below freezing, and it takes only one hard night to split an unprotected line. The housing side of the equation is the metro's older stock — homes from the 1990s and earlier, plumbed before freeze protection was routine, with lines in exterior walls and unheated crawl spaces that modern builds route through conditioned space instead.
A water heater under strain complains in a consistent order. First the recovery slows: back-to-back showers end in a lukewarm truce. Then the noises begin — sediment on the tank floor superheating pockets of water into small, kettle-like pops. Then the pilot or the elements start their intermittent failures. In Charlotte the strain is structural: 1,769 cooling degree days of demand against 3,058 heating degree days of cold inlet water, cycling the metro's tanks without an off-season. Servicing interrupts the order at whichever stage it has reached; the tank's age and the sediment's depth decide whether the interruption is a repair or a retirement.
Two heaters of the same age can live very different lives in this metro, and the difference is usually maintenance rather than luck. The attended tank — sediment drained yearly, anode checked before it is spent, temperature kept sane — routinely outlasts its neglected twin by years. The neglected one's decline announces itself in the water first: a rust blush at the hot tap, a sulphur note after holidays, hot water that arrives carrying the tank's interior with it. By the time the symptoms are that descriptive, the conversation has usually moved from servicing to succession planning.
The demand side, from the Census: 1,049,805 households, most heating water daily, in a metro where the hot season runs long and the cold snaps are sharp. Appliance populations that large, worked that hard, fail on a distribution — and the distribution's peak is what a ranking like this one is measuring.
The galvanized story can be told at a single tap. Open the fixture farthest from the meter in a Charlotte home still on its original steel and watch the stream: respectable for a moment, then thinning as the narrowed runs upstream ration the flow. That rationing is the material's old age made visible — decades of internal rust taxing every gallon. The metro holds 341,983 pre-1980 homes, and in the ones never repiped, the tax rises yearly. Unlike most plumbing failures, this one is perfectly forecastable: the tap has been reporting it, patiently, for years.
Galvanized pipe fails politely, which is precisely the problem. No flood, no drama — just a shower that weakens across years, a washing machine that fills slowly, water that blushes rust after holidays. Households adapt without noticing, the way you adapt to a dimming bulb. The 196,070 homes built in this metro between 1960 and 1979 stand in the front of that queue now, their original steel bores narrowed to drinking-straw width in the worst runs. The fix, when it comes, tends to astonish people — not with its scale, but with the pressure they had forgotten they were owed.
The replacement side of the ledger is equally local: when a Charlotte home of the galvanized era is sold, inspected or renovated, the supply lines are among the first systems examined — because everyone in the local trade knows the material's age here. A pattern the whole market has learned to look for is not an anecdote; it is the metro's housing data wearing a tape measure.
Between the house and the street connection sits the lateral — the home's own stretch of sewer line — and it is the homeowner's responsibility, which surprises many people the first time it fails. In Charlotte, where 12.8% of homes were built before 1960 and the median home dates to 1994, laterals have been in the ground through decades of soil movement, root growth and material ageing. Clay joints shift and open, older pipe bellies where bedding has washed out, and a line can lose its clean fall to the street, so waste slows, settles and eventually blocks. The signs are house-wide rather than fixture-specific: several drains slow together, the ground-floor fixtures act up first, and cleanings help for shorter and shorter stretches. A camera run down the lateral settles the argument about what is happening — it measures the damage by distance, shows whether it is one bad joint or the whole story of the line, and lets the repair be sized to the actual problem instead of the whole run by default.
A lateral gives decades of silence and then a short conversation. The conversation usually starts with the ground-floor drain in the house and escalates through the cleanout to the camera — and the camera's footage settles every argument about whether the line is blocked or broken. Across Charlotte, the laterals entering that conversation now are the ones buried when the metro's median home went up, in 1994. They were built to outlast their mortgages, and they have; the question the footage answers is how much further the same pipe can honestly be asked to go.
The census figures draw the map: 145,913 homes from before 1960 and a median build year of 1994 mean the typical lateral in Charlotte has been buried for decades, and the oldest have passed the service life their materials were expected to give. Multiply one buried line by 1,139,944 housing units and the pattern's rank on this page stops being surprising.
Preparation in Charlotte is a short list done on a mild day: insulate the runs you can reach, disconnect and drain the garden hoses, and make sure every adult in the house knows the main shutoff's location. The cold snaps in the record at CHARLOTTE DOUGLAS AP, NC US do not arrive every week, but the pipes they damage are damaged in a single night — the work that prevents it takes an afternoon.
A snap is a sorting mechanism: it passes over the metro's well-built plumbing entirely and stops at the runs that were never protected — the bibb on the north wall, the line over the garage, the crawl-space run in a pre-1980 home. Charlotte has 341,983 of those homes. The morning after a snap, the map of calls is simply the map of exposure, drawn by the cold itself.
What makes the slab leak the defining pattern of the growth-era metro is the combination of concealment and consequence. Concealment, because the line is entombed: no crawl space to inspect, no basement ceiling to stain. Consequence, because the escaping water undermines the very ground the slab rests on and feeds the heater a second, phantom household to supply. Charlotte's slab stock spans both the post-war tracts and the 461,677 homes built since 2000 — the pattern crosses eras wherever the concrete does — and its detection has become a small science of meters, microphones and thermal cameras precisely because eyes are useless here.
Read the ranking backwards and it reads as a data summary: 2,712,818 residents in 1,139,944 housing units, 12.8% of the housing from before 1960, 43.6 inches of rain in an average year. The pattern leads because the exposure is broad — counted not in individual unlucky houses but in whole eras of the metro's building, stacked one on another.
Experienced local practice starts with the simple certainties — the observations that take minutes and decide the most:
Ordered by what this metro's data says its homes need most.
A leak announces itself indirectly: a bill creeping up, a meter that never rests, paint blistering in a room with no plumbing. The detection visit follows those signs with instruments until the evidence converges, because repairing the wrong spot costs twice — once for the hole, once for the leak still running.
Hidden leaks in Charlotte hide in the places this metro built: under slabs in the post-war and growth subdivisions, inside walls in the older districts where 30.0% of homes predate 1980, and along yard lines crossing soil that shifts with the seasons. The detection approach follows the construction — acoustic listening carries well through slab concrete, while older framed homes give up their leaks to moisture mapping and pressure isolation. Either way, the search starts from the meter: a Charlotte home losing water with every tap closed has a fact to chase, and the instruments chase it to a single marked spot. With a median build year of 1994, most of the metro's 1,139,944 housing units are working through the same ageing curve.
Scale the problem by the Census count and it stays concrete: 1,139,944 housing units, each a small network of pressurised lines, each capable of losing water silently. The meters across Charlotte register those losses in aggregate; the detection visit exists to assign one of them to one address — in Concord this month, somewhere else next.
One local habit worth copying: Charlotte homeowners who mention their street's building era when they book get a better-matched visit, because a plumber heading to a the 1990s home in Anson County loads different parts than one heading to a slab-built subdivision in Concord. The service is the same; the preparation is local.
Pipes age by material: galvanized chokes with rust, copper pits into pinholes, early plastic turns brittle. Repair answers the isolated failure; repiping replaces a system whose failures have become a rhythm, rerunning supply lines in modern material while the house stays liveable around the work.
Homes in Charlotte ask the repair-or-repipe question in a particular order. First one leak, repaired. Then another, in the same material, a year later. Pressure meanwhile declines across every fixture, and the water runs discoloured after the house sits quiet. That sequence — which plays out across the metro's pre-1980 housing especially — is the material delivering its verdict, and repiping in PEX or copper is the answer that ends the sequence rather than extending it by one more interval. The CHARLOTTE DOUGLAS AP, NC US record — 3,058 heating degree days, 1,769 cooling — is the backdrop Anson County plumbers plan around.
Pipe work divides by era in this metro with unusual neatness: renewal conversations in the 341,983 pre-1980 homes, sectional repairs in the middle ring, and near-silence from the 461,677 post-2000 homes whose lines are still young. A call from Rock Hill can sit in any of the three bands; the home's build year says which before the door opens.
Where this service gets booked in Charlotte follows the map on this page: the older districts generate the deep-end work, the post-2000 subdivisions the wear-and-tear work, and the 336,283 homes in between split the difference. Telling the call center your home's build decade — most Charlotte owners know it within a few years — puts the right kit on the van the first time.
Everything hot in a house — showers, laundry, dishes — passes through one tank, which is why its failures empty the whole routine at once. Servicing covers the wearing parts and the safety valve; installation work sets its successor up level, vented, drained and strapped, ready for its own decade of mornings.
Stand in a Charlotte street and count rooflines and you are also, roughly, counting water heaters by age. The subdivisions went up in waves and their tanks were fitted in the same weeks, so the metro's heater fleet ages in convoys — quiet for years, then a whole street replacing within a few seasons. The pre-1980 districts run a different rhythm, individual tanks on individual schedules inside older plumbing. Both rhythms end at the same judgement, made on evidence rather than birthdays: the tank's condition, its repair history, and the household's patience for cold showers while the argument settles. The 43.6 inches of rain in an average year here is part of the story too — buried lines feel every wet season.
Heater work in this metro is a fleet problem: the tanks were installed in waves with the subdivisions, and they reach their verdicts in waves too. Kannapolis (56,470 residents) sits inside one of those waves; the older districts run their own, one tank at a time, inside plumbing a generation older.
In Charlotte this service is booked most often through the problem patterns at the top of this page — the metro's housing data, not habit, sets the order. If your home is in the 30.0% built before 1980, mention its age on the call: it changes the parts the plumber loads before heading to Charlotte and the rest of the metro.
Roots, offsets, bellies, corrosion — the camera distinguishes them, and each has a different remedy at a different scale. That is the whole logic of sewer work: see the line first, then decide whether it needs a clearing, a section, or a new run entirely.
Every home in Charlotte drains to one line, and that line's condition is written in the metro's housing data: a median build year of 1994 means half the metro's laterals have been buried for decades, ageing in step with the houses above them. In the newer areas — 40.5% of homes built since 2000 — the pipe is plastic and the problems are different: bellies where bedding settled, construction debris, a joint shifted by soil movement. The camera inspection is the same either way, and it is what sizes the job: spot repair, partial replacement, or the full run, each with footage to justify it. That is the daily reality for the 1,049,805 households spread across Anson, Cabarrus, Gaston, Iredell, Lincoln, Mecklenburg, Rowan, Union, Chester, Lancaster, York.
Sewer demand follows the founding map: the districts built first, around the old centre and out through Indian Trail, hold the jointed clay and iron; the growth rings hold plastic with decades in hand. 12.8% of the metro's homes stand on the founding side of that line, which is why the footage here so often shows a pipe at the end of its story.
One local habit worth copying: Charlotte homeowners who mention their street's building era when they book get a better-matched visit, because a plumber heading to a the 1990s home in Anson County loads different parts than one heading to a slab-built subdivision in Concord. The service is the same; the preparation is local.
One call from anywhere in the Charlotte metro — from Charlotte out to Rock Hill — routes to the local professional on cover; the failure patterns they expect first are the ones this page's data ranks.
Across Anson, Cabarrus, Gaston, Iredell, Lincoln, Mecklenburg, Rowan, Union, Chester, Lancaster, York, drain calls follow the building map: iron and clay near the old core around Charlotte, plastic at the growth edge — one service, two different crafts, both covered by the routing on this page.
Toilet calls in Charlotte are the small end of the diary and the most democratic: every era of the 1,139,944-home stock produces them, and the local fix starts with the mechanism in the tank, not the porcelain.
Drips and disposals across Anson, Cabarrus, Gaston, Iredell, Lincoln, Mecklenburg, Rowan, Union, Chester, Lancaster, York are small jobs with a standard: repair the mechanism where the fixture deserves it, renew it where it does not, and check the shutoffs and supply lines while the cabinet is open.
Bookings in this metro have a centre of gravity, and it sits on the two patterns this page ranks first: Slab leaks under concrete foundations, then freeze-burst pipes in cold snaps. Everything a local service operation does — the vans' stock, the week's scheduling, the order of this very list — bends around that gravity. A homeowner reading the services above is therefore reading something more specific than a menu: a forecast of what a home like theirs, in a metro built like this one, is most likely to need, in the order it is most likely to need it.
 PROBLEM
 SOLUTION
Population 886,283
Population 106,518
Population 81,632
Population 74,769
Population 62,458
Population 56,470
Population 51,447
Population 41,146
Population 35,730
Population 35,596
Population 32,009
Population 29,959
Also in the Charlotte metro: Statesville (population 29,161), Fort Mill (population 28,281).
Beyond Charlotte itself, the metro takes in Concord (106,518 residents), Gastonia (81,632) and the rest of the communities in the grid above — each plumbed in its own building era, which is why two streets in the same metro can need entirely different plumbing conversations. The ZIP list below is the full coverage footprint: if your code is on it, this page was written about your housing stock.
The map continues: Rock Hill (74,769), Huntersville (62,458), Kannapolis (56,470), Mooresville (51,447), Indian Trail (41,146). Different names, different decades — each community in Anson, Cabarrus, Gaston, Iredell, Lincoln, Mecklenburg, Rowan, Union, Chester, Lancaster, York was plumbed in its own growth years, which is why two streets in the same metro can need entirely different plumbing conversations. The ZIP list below is the working definition of coverage; the housing behind each code is the working definition of the job.
Charlotte (886,283 residents) anchors the metro, and Concord (106,518) is its second centre of gravity. Between them they hold the bulk of the 1,049,805 households — and, not coincidentally, the bulk of every housing era this page discusses, from the pre-1960 core to the newest subdivisions. Gastonia (81,632) and the communities beyond it repeat the same eras at smaller scale.
The metro answers to 11 county governments (Anson, Cabarrus, Gaston, Iredell, Lincoln, Mecklenburg, Rowan, Union, Chester, Lancaster, York), a patchwork that matters at permit time rather than at the pipe. Anson County carries the centre; the others carry the growth rings and the older outlying towns. A plumber routed through this page works inside that patchwork daily — the water does not care about the boundaries, but the job's paperwork does.
This page ends at the metro boundary, but the region does not: Hickory, NC, Winston-Salem, NC and Greensboro, NC continue the coverage in their own directions, each with a profile built from its own Census and NOAA figures. If your home sits near the line between metros, go by your ZIP code — it places you in the dataset that describes your housing.
The region around Charlotte is a set of variations on its theme: Hickory, NC, 55 miles off, runs a median build year of 1983 on a metro population of 376,890; Winston-Salem, NC (65 miles) medians 1984 on 712,206; Greensboro, NC (82 miles) medians 1985 on 805,945. Nearness is not sameness — a few decades of median build year separate their plumbing as surely as the miles separate their maps.
The stock has a shape as well as a size. Owners hold 65.8% of it and renters 34.2%, a split that decides who notices a drip first and who arranges the repair. The generations split 0.7-to-one in favour of the pre-1980 homes. And the map divides into 14 named communities across Anson, Cabarrus, Gaston, Iredell, Lincoln, Mecklenburg, Rowan, Union, Chester, Lancaster, York, each carrying its era's share of the 1,139,944 housing units the Census counts here.
Charlotte by the derived numbers — median home age 32 years · owners in 690,772 homes, renters in 359,033 · each covered ZIP code carrying about 1,206 pre-1960 homes · a heating-to-cooling degree-day ratio of 1.73 · 1,107 mm average annual rainfall.
Before an emergency, read the guide: How to shut off your home's water main
Describe the problem and the call center routes you to an independent local plumber who works in the Charlotte metro.
Call center hours: Mon-Fri 7:00 AM-10:00 PM ET | Sat 8:00 AM-10:00 PM ET | Sun 7:00 AM-9:00 PM ET