

A metro's plumbing is a portrait of its building history under its weather, and Buffalo's portrait is painted below from its own records: Census housing figures, NOAA climate normals, the metro's ZIP codes and communities. PlumbReach USA's role is the connection to a local professional; the portrait is here so that connection starts from understanding rather than urgency.
Call center hours: Mon-Fri 7:00 AM-10:00 PM ET | Sat 8:00 AM-10:00 PM ET | Sun 7:00 AM-9:00 PM ET
The median Buffalo home was built in 1957; 76.8% of the stock predates 1980, and the pattern this metro's own data ranks first is ageing cast iron sewer lines. PlumbReach USA is a referral service, not a plumbing company: one call connects you with an independent local plumber serving your ZIP code.
The stock, in one pass: 1,161,385 residents, 540,322 housing units, 500,204 households — and a build history that splits the metro into plumbers' generations. 55.5% of homes stand from before 1960; 76.8% from before 1980; the rest divide between the late-century suburbs and the 9.4% built since 2000. Every era is a materials decision still in force: the pipes in a Buffalo wall are the ones its decade specified, ageing on that decade's schedule, whatever the current owner's plans for them.
Ask how Buffalo's older homes have been kept and the honest answer is: in pieces. A water heater here, a repipe there, one bathroom renewed while the rest of the system carries on — across 414,967 pre-1980 homes, the patchwork is the norm rather than the exception. That history is written in the walls of Erie County and everywhere else the early stock stands: systems that are part original, part renewed, and entirely individual. It is also why the guidance on this page keeps returning to patterns rather than single faults — in a patchwork system, the pattern is the diagnosis.
Uniformity is the newer stock's defining trait. A subdivision in Cheektowaga or Tonawanda Town went up in a handful of years, fitted with one generation of fixtures, one heater model class, one approach to running lines under slabs. That uniformity writes a calendar the whole street shares: the first heater wave, the first cartridge wave, the first questions about lines under concrete arrive together, years before the same streets need anything structural. With 9.4% of the metro built since 2000, that calendar governs a large and growing share of Buffalo's plumbing work — predictable work, if a household reads the calendar early.
The weather's part in this is written at BUFFALO, NY US, where an average year carries 40.68 inches of precipitation, 3.4 days at ninety degrees or more and 123.7 nights at freezing or below. Pipes experience that year as workload and as hazard in roughly equal measure — the workload in the heater's cycle count and the drains' burden, the hazard in the exposed runs and the swelling soil. The problem ranking further down is simply the housing profile above, read under this sky.
The metro's building eras on one side, its weather record on the other — and its plumbing where the two meet.
Break the stock down by building era and the profile sharpens. Before 1960: 55.5% of homes, roughly 299,879 of them. From 1960 to 1979: 21.3%, about 115,089. From 1980 to 1999: 13.8%, about 74,564. Since 2000: 9.4%, about 50,790. Four eras, four material palettes — and the balance among them is this metro's plumbing character in a single paragraph.
The centre of gravity here is the deep stock: with pre-1960 homes the largest single band, Buffalo's typical plumbing conversation starts with materials that have been underground or in walls for sixty years and more — cast iron drains at the end of their design lives, galvanized runs narrowed by corrosion, and laterals that predate the neighbourhoods around them. Newer work exists, out at the growth edge, but the metro's character — and most of its serious plumbing — sits in the old core and the streets that grew from it.
The second band in the table is the 1960-1979 stock: 115,089 homes, 21.3% of the metro. It is the transition generation — copper arriving, galvanized lingering, drains mixed street by street — and it supplies Buffalo with its most diagnostic plumbing: two homes of the same year needing opposite answers, decided by what the builder happened to specify.
Start the climate half where the water starts: underground. Buffalo's laterals rest in soil that takes 40.68 inches of rain in an average year and dries between deluges, swelling and shrinking against their joints through every season. Above ground the same record reads as workload — 608 cooling degree days of hot-water demand, 6,466 heating degree days of cold incoming water at BUFFALO, NY US. A plumbing system here is never in neutral; the record keeps it working at one end or the other all year.
A profile is only useful if it predicts something, and this one predicts the shape of a plumbing diary in Buffalo: which streets will call about drains, which about pressure, which about heaters, and in which months. Everything after this section is that prediction written out as services, problems and answers — the numbers first, the narrative second, the way the evidence actually runs.
Ranked for this metro alone, from its Census housing profile and NOAA climate record.
Iron drains do not fail the way modern pipes fail. Plastic cracks; iron thins, roughens and narrows from within, wall by wall, until the smooth bore the installer left is a reef of corrosion products that catches everything the household sends down. In Buffalo, that reef is growing under the oldest streets in the metro — the homes around Buffalo plumbed when iron was the only serious choice. A line in this condition can serve for years in a diminished way, draining slowly, complaining occasionally, which is exactly how it escapes attention until the day it stops entirely.
The pipe itself explains the timeline. Cast iron drains by gravity, slowly, and everything a household sends down it — grease films, mineral-heavy water, the occasional corrosive cleaner — works on the iron for decades. The metal does not fail evenly: it thins first at the bottom of horizontal runs, where water and grit sit longest, and at the joints where sections meet. That is why two Buffalo homes of the same age can be in different places with the same pipe: usage, water chemistry and soil conditions around the line all vote on how fast it goes. What a camera inspection adds is certainty — the difference between a line that needs cleaning, a line that needs a section replaced, and a line living on borrowed time.
The local weight of it: 299,879 homes in this metro predate 1960, and while some have renewed their drains since, every original line still serving is past the age its installers planned for. That is a population of risk no single street explains — it is the metro's founding stock, failing on a schedule set in the post-war decades.
Galvanized steel pipe was plumbed into millions of homes, and it ages in a particular way: the zinc coating gives out, the steel rusts, and the rust grows inward until the pipe that once carried a full stream is choked to a fraction of its width. With a median build year of 1957 and 76.8% of its homes predating 1980, Buffalo has a large stock of housing in the galvanized era, and its symptoms are the classic ones — pressure that has faded a little more each year, water that runs rusty after the house sits quiet overnight, and leaks that begin appearing at joints. No cleaning reverses this; the corrosion is the pipe itself converting to rust. The judgement call is timing. A galvanized system with one small leak and acceptable pressure can be repaired and watched. A system leaking in several places, with pressure dropping across every fixture, is telling you the material has finished its service life, and each repair buys a shorter quiet interval than the last. Repiping in PEX or copper replaces the whole question with a new system and restores the pressure the home was built with.
The geography of galvanized failure inside one house is uneven, and the unevenness misleads people. The runs nearest the water heater corrode fastest, worked by heat; long horizontal runs narrow differently from vertical risers; the line to a little-used guest bathroom may be nearly closed while the kitchen still flows. This is why a Buffalo home can seem fine at most taps while one shower has given up entirely. Repiping answers the whole geography at once, which is its real argument: not that any single run has failed, but that the system's remaining life is scattered unevenly through every wall, and spot repairs keep buying the shortest-lived section.
Count it by era rather than by street: the metro's homes built between the war years and 1980 — the heart of the galvanized period — number in the tens of thousands here, and the 414,967 pre-1980 homes overall are the pool this problem draws from. Plumbers working Buffalo and the older districts can often date a home's pipework from the kerb, because the building booms that raised those neighbourhoods plumbed them all the same way.
There is a particular silence after a hard freeze in Buffalo: the pause while households open taps one by one, auditing the night. Most winters, most homes pass. The failures cluster where they always cluster — the addition plumbed in a hurry across a crawl space, the garage wall line, the hose bibb nobody drained — because cold air is a systematic inspector and it works from a list. The record at BUFFALO, NY US guarantees the inspection recurs: this is not a freak-weather problem but a standing appointment between the climate and the metro's least-protected pipework, kept every year whether the household remembers it or not.
Prevention, for this pattern, is a geography lesson: the burst never happens in the middle of the heated house. It happens at the perimeter — the wall cavity on the windward side, the run beneath the addition, the pipe the builder routed through the garage to spare six feet of copper. In Buffalo, where 3.4 summer days tempt everyone to forget what 123.7 freezing nights intend, the autumn ritual is short and specific: find every line that leaves the warmth, and do something about it. The households that keep that ritual read about burst pipes the way other people do — as news.
Local exposure, stated plainly: a large stock of homes plumbed before freeze protection was designed-in, standing in a climate that freezes on 123.7 nights a year. Either figure alone is unremarkable; together they describe a metro where burst lines are a seasonal category of call, not an anomaly.
Ownership is the first surprise with a lateral: the buried stretch between the house and the street main typically belongs to the homeowner, however public it feels. The second surprise is its age. In Buffalo, laterals under the older streets were laid for the homes counted in the 414,967 pre-1980 properties — jointed clay or iron, bedded in soil that has swelled and shrunk through 40.68 inches of rain a year ever since. A pipe can be nobody's thought for fifty years and then become the only thought in the house, usually on the evidence of the ground-floor drain in it.
Slope is the lateral's invisible specification. A sewer line does not need much fall — a quarter inch per foot is the classic figure — but it needs it consistently, and ageing takes consistency away: a section settles, a joint steps down, and the line develops a reach where flow slows and solids settle out. That belly then collects a little more each week, narrowing the line from the bottom up. Many a Buffalo lateral diagnosed as 'blocked' is really 'bellyed' — clearable today, certain to collect again. The camera distinguishes the two, and the distinction decides whether the household is booking a cleaning or planning a repair.
Every one of the metro's 540,322 housing units drains through exactly one lateral, and in the older districts those laterals are as old as the streets above them. The pre-1960 share alone — 299,879 homes — represents that many buried lines in their seventh decade of service, under soil that shifts with Buffalo's wet and dry seasons. Most will never draw attention; the ones that fail announce themselves through the ground-floor fixtures first.
Living with a real winter, as Buffalo does, means the season has a rhythm: the first hard freeze finds the unprepared lines, mid-winter tests the insulation, and the late thaws reveal whatever split quietly weeks before. Households that drain exterior lines in autumn and keep a trickle running on the coldest nights get through most winters with nothing to report.
The numbers behind the season here: 123.7 nights a year at or below freezing at BUFFALO, NY US, against a housing stock whose median build year is 1957. Every winter writes the same exam for Buffalo's older pipes, and every winter some of them — usually in the the 1950s districts first — fail it.
The telltale geography here is generational. Cast iron under a Buffalo street means the street predates the metro's plastic era — the blocks around Buffalo first, the early suburbs second, almost nothing built after the material left standard practice. A homeowner in those blocks owns a drain in its eighth or ninth decade, and the diagnostic question is never whether the iron has corroded — it has — but how far the corrosion has travelled: a section, a run, or the whole line to the street. Cameras answer it street by street, house by house, and the answers in the oldest blocks rhyme closely enough that experienced local plumbers can often predict the footage before they see it.
The numbers underneath it, for Buffalo: 540,322 housing units, a median build year of 1957, and a climate record at BUFFALO, NY US of 6,466 heating degree days against 608 cooling degree days. Cross the housing record with the weather record and this pattern is what falls out at the top — rarely the most dramatic problem in plumbing, but the one this metro's stock and climate manufacture most steadily.
Experienced local practice starts with the simple certainties — the observations that take minutes and decide the most:
Ordered by what this metro's data says its homes need most.
Roots, offsets, bellies, corrosion — the camera distinguishes them, and each has a different remedy at a different scale. That is the whole logic of sewer work: see the line first, then decide whether it needs a clearing, a section, or a new run entirely.
The sewer lines under Buffalo are as old as its oldest streets. 55.5% of homes here were built before 1960, when clay and cast iron were the standard materials, and those lines have now carried sixty-plus years of service under soil, roots and traffic. The failures cluster where the trees are mature and the pipe is jointed — the established neighbourhoods around Buffalo and the historic core — because roots have had the most years to find the joints. A camera run tells the truth about any given line: how much is scale and roots that cleaning can handle, and how much is a pipe at the end of its story. That is the daily reality for the 500,204 households spread across Erie, Niagara.
Under Buffalo lie 540,322 laterals, one per housing unit, and the oldest of them — beneath the 299,879 pre-1960 homes — have been underground since the metro was a fraction of its present size. The camera diary in Cheektowaga and the old core is written by that buried generation.
One leak is an event; three in a year is a verdict. Pipe work weighs that pattern — the metal's age, the water's behaviour, the repair history — and either fixes the section in front of it or proposes the honest larger job: a whole-house repipe that ends the rhythm for good.
Every pipe in Buffalo is in one of three conditions: new enough to forget, old enough to watch, or old enough to be living on borrowed time. The stock's distribution across those conditions is the metro's building history restated — the pre-1980 districts deep in the third condition, the growth corridors still in the first — and pipe services are how individual homes move between them. A repair returns a watched system to service; a repipe promotes a borrowed-time system back to the first condition wholesale, at a stroke, for another generation. The assessment that chooses between them is short, physical and evidenced: pressure, water colour, and the repair history in the walls. Count it in homes if you prefer: 414,967 built before 1980, 50,790 since 2000, one shared system of soil and seasons.
Pipe work divides by era in this metro with unusual neatness: renewal conversations in the 414,967 pre-1980 homes, sectional repairs in the middle ring, and near-silence from the 50,790 post-2000 homes whose lines are still young. A call from Niagara Falls can sit in any of the three bands; the home's build year says which before the door opens.
One call from anywhere in the Buffalo metro — from Buffalo out to Niagara Falls — routes to the local professional on cover; the failure patterns they expect first are the ones this page's data ranks.
Across Erie, Niagara, drain calls follow the building map: iron and clay near the old core around Buffalo, plastic at the growth edge — one service, two different crafts, both covered by the routing on this page.
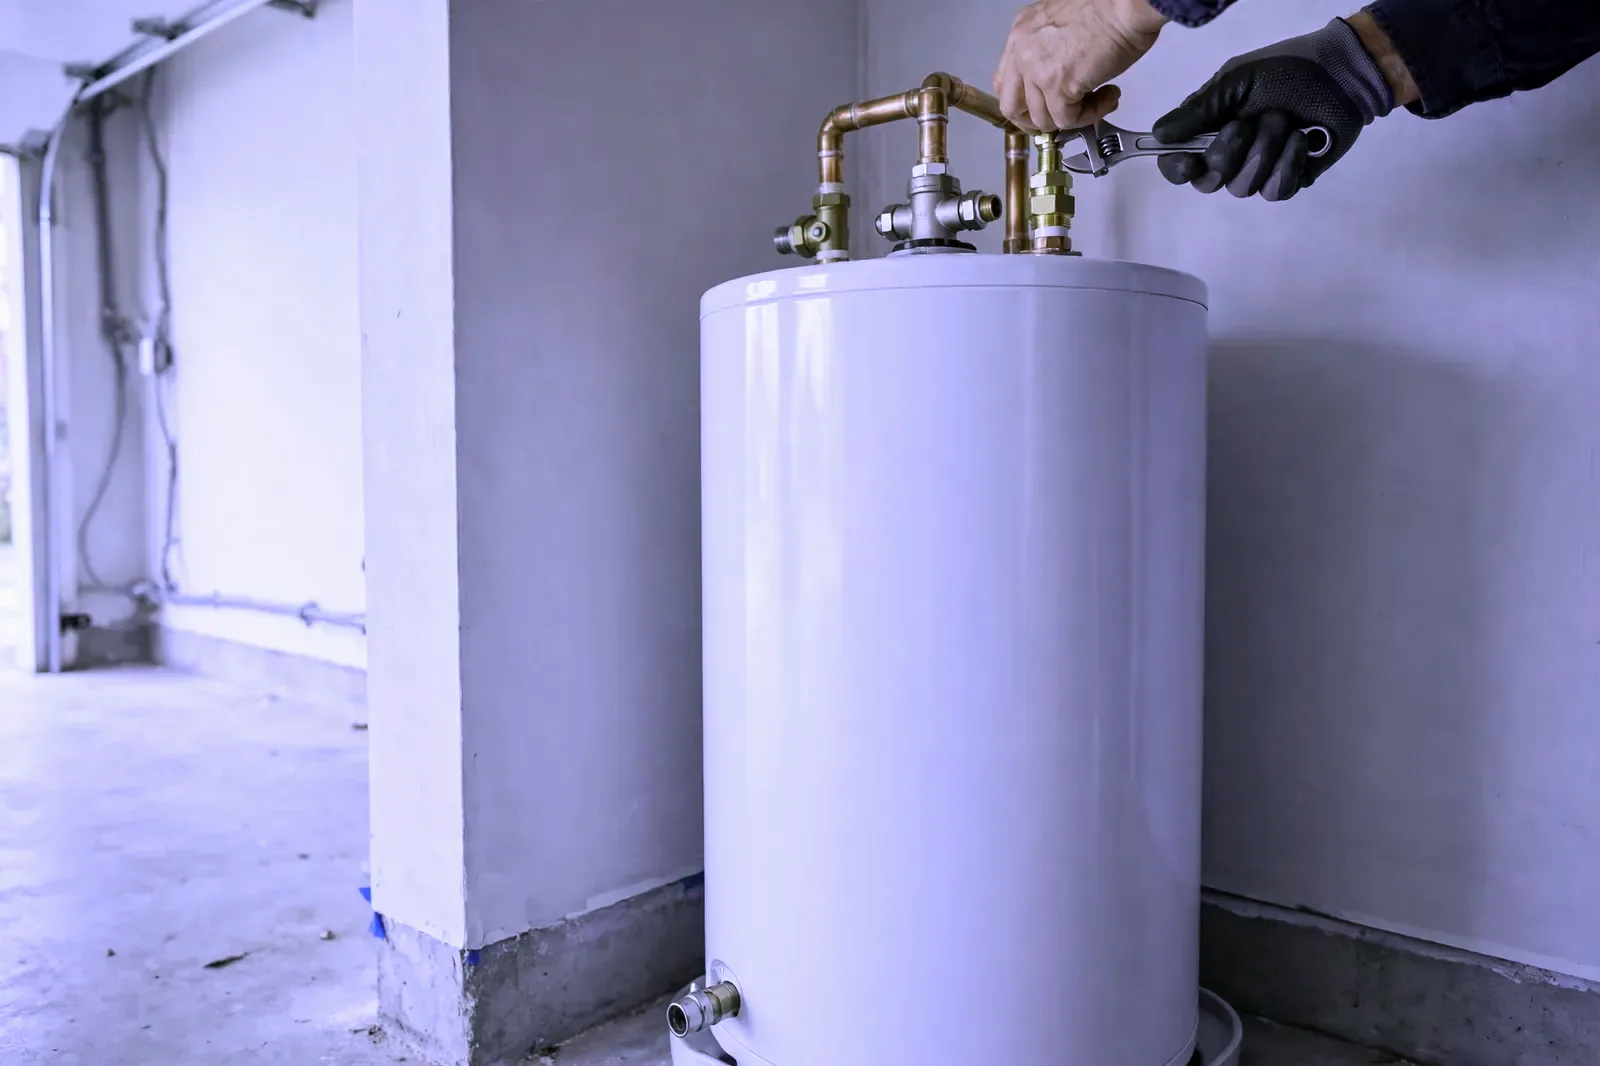
Heater work in Buffalo is workload work: 3.4 hot days and 6,466 heating degree days a year cycle the metro's tanks hard, and the local professionals routed here size, flush and replace against that record.
The meter test starts it in Buffalo as everywhere; what follows is local — knowing which of Erie, Niagara' eras hide lines in slabs, which in crawl spaces, and where the soil movement at BUFFALO, NY US's record makes joints let go.
Toilet calls in Buffalo are the small end of the diary and the most democratic: every era of the 540,322-home stock produces them, and the local fix starts with the mechanism in the tank, not the porcelain.
Drips and disposals across Erie, Niagara are small jobs with a standard: repair the mechanism where the fixture deserves it, renew it where it does not, and check the shutoffs and supply lines while the cabinet is open.
Two patterns generate most of the bookings behind the services above: Ageing cast iron sewer lines and galvanized pipes at the end of their life. That is why the order of this page's service list is what it is — the services answering those patterns come early, and the rest follow in the order the metro's data supports. A homeowner whose home matches the local profile — built in the metro's big decades, in one of its older districts — is, statistically, reading their own shortlist.
 PROBLEM
 SOLUTION
Population 276,397
Population 76,251
Population 56,973
Population 48,198
Population 45,329
Population 30,338
Population 20,699
Population 19,779
Population 15,416
Population 15,097
Population 15,065
Population 15,044
Also in the Buffalo metro: Lancaster (population 10,127), Hamburg (population 9,762).
Beyond Buffalo itself, the metro takes in Cheektowaga (76,251 residents), Tonawanda Town (56,973) and the rest of the communities in the grid above — each plumbed in its own building era, which is why two streets in the same metro can need entirely different plumbing conversations. The ZIP list below is the full coverage footprint: if your code is on it, this page was written about your housing stock.
Also on the Buffalo map: Niagara Falls (48,198), West Seneca (45,329), North Tonawanda (30,338), Lockport (20,699), Lackawanna (19,779) — communities spread across Erie, Niagara, each with housing from its own growth years. A plumber routed through PlumbReach USA to any of them is working from this same page: the metro data does not change at the city limit, but the housing on your street — its age, its materials, its soil — is what the visit is really about.
Every metro has a first city and a supporting cast, and the census figures draw the billing plainly here: Buffalo first, with 276,397 residents; Cheektowaga second at 76,251; Tonawanda Town third at 56,973; then the long tail of smaller communities in the grid above. The billing matters less than the building dates — each of these places was plumbed in its own decade, by its own builders — but between them they account for nearly every housing era, material and failure pattern this page describes.
The metro answers to 2 county governments (Erie, Niagara), a patchwork that matters at permit time rather than at the pipe. Erie County carries the centre; the others carry the growth rings and the older outlying towns. A plumber routed through this page works inside that patchwork daily — the water does not care about the boundaries, but the job's paperwork does.
This page ends at the metro boundary, but the region does not: Rochester, NY, Syracuse, NY and Binghamton, NY continue the coverage in their own directions, each with a profile built from its own Census and NOAA figures. If your home sits near the line between metros, go by your ZIP code — it places you in the dataset that describes your housing.
The region around Buffalo is a set of variations on its theme: Rochester, NY, 60 miles off, runs a median build year of 1966 on a metro population of 1,056,149; Syracuse, NY (140 miles) medians 1964 on 652,273; Binghamton, NY (151 miles) medians 1960 on 243,189. Nearness is not sameness — a few decades of median build year separate their plumbing as surely as the miles separate their maps.
The stock has a shape as well as a size. Owners hold 66.5% of it and renters 33.5%, a split that decides who notices a drip first and who arranges the repair. The generations split 8.2-to-one in favour of the pre-1980 homes. And the map divides into 14 named communities across Erie, Niagara, each carrying its era's share of the 540,322 housing units the Census counts here.
Buffalo by the derived numbers — median home age 69 years · owners in 332,636 homes, renters in 167,568 · each covered ZIP code carrying about 3,408 pre-1960 homes · a heating-to-cooling degree-day ratio of 10.64 · 1,033 mm average annual rainfall.
Before an emergency, read the guide: How to shut off your home's water main
Describe the problem and the call center routes you to an independent local plumber who works in the Buffalo metro.
Call center hours: Mon-Fri 7:00 AM-10:00 PM ET | Sat 8:00 AM-10:00 PM ET | Sun 7:00 AM-9:00 PM ET